
Feeling overwhelmed by the numbers in your analytics dashboard is a shared experience for many store owners. If you’re eager to turn data into action but get tripped up by unfamiliar metrics, you’re not alone. Ecommerce analytics terminology is the key to understanding customer behavior, sales trends, and the effectiveness of your marketing so you can make confident decisions. This guide will help you recognize which definitions and concepts matter most for your store’s retention and growth.
Table of Contents
- Defining Ecommerce Analytics Terminology
- Core Metrics And Their Meanings
- Data Types And Analysis Methods
- Customer Segmentation And Product Bundling Terms
- Common Mistakes And Misinterpretations
Key Takeaways
| Point | Details |
|---|---|
| Understanding Ecommerce Analytics | Familiarizing yourself with key metrics like Conversion Rate and Average Order Value is crucial for optimizing business performance. |
| Prioritize Core Metrics | Focus on 5 to 10 essential metrics that directly impact revenue and customer engagement to prevent analysis paralysis. |
| Avoid Common Pitfalls | Stay vigilant against vanity metrics and ensure metrics align with actual business outcomes to make informed decisions. |
| Leverage Data Types | Utilize different data types effectively; distinguish between transactional, behavioral, and demographic data to guide your analysis. |
Defining Ecommerce Analytics Terminology
Ecommerce analytics terminology forms the foundation of everything you do as a store owner or marketing manager. Without understanding these terms, you’re essentially flying blind when it comes to optimizing your business. You might see a metric in your dashboard and not realize what it actually means for your bottom line. The good news? Most ecommerce terminology falls into clear, logical categories that make sense once you see how they connect to your actual sales and customer behavior.
At its core, ecommerce analytics refers to the systematic measurement and analysis of customer interactions across your online store. This covers everything from how visitors find your site, which products they view, what they add to their cart, and ultimately what they buy. Understanding ecommerce analytics terminology helps you speak the same language as your tools and platforms, whether that’s Google Analytics, Shopify, or specialized analytics software. You’re looking at data around B2C transactions (business to consumer sales), customer demographics, product performance, and traffic sources. These measurements give you the ability to spot patterns in what works and what doesn’t in your store.
The terminology breaks down into several practical categories. Transaction metrics track what customers buy and how much they spend. Traffic and behavioral metrics show you where customers come from and what they do on your site. Customer metrics segment your audience based on purchase history, spending habits, and loyalty. Product metrics reveal which items drive revenue and which sit idle. Ecommerce transaction data classifies sales into formats like direct purchases, marketplace transactions, and subscription models. When you master these categories, you can actually interpret the numbers staring back at you in your reporting dashboards instead of feeling lost in a sea of percentages and averages.
Here’s what makes this practical: when your analytics platform shows you a metric like “conversion rate” or “average order value,” you now understand exactly what that number represents and why it matters. You know conversion rate is the percentage of visitors who complete a purchase, and average order value tells you the typical revenue per transaction. Armed with these definitions, you can spot opportunities. If your conversion rate drops 2% month over month, you know to investigate your checkout process or site speed. If average order value stays flat while traffic increases, you recognize the need for better product bundling or upsell strategies.
Pro tip: Start by identifying which 5 to 10 metrics matter most to your specific business goals, then learn those definitions inside and out before trying to master everything. This focused approach prevents overwhelm and helps you take action faster.
Core Metrics and Their Meanings
Once you grasp the foundational concepts, the real work begins: understanding which metrics actually matter for your store. Most ecommerce store owners track dozens of metrics without realizing they’re watching noise instead of signals. You need to know the difference between vanity metrics that look good in reports and actionable metrics that drive decisions. The core metrics fall into five buckets that directly connect to your revenue and customer relationships.
Conversion Rate is your first essential metric. This is the percentage of visitors who complete a purchase, calculated by dividing transactions by total visitors. If you get 10,000 visitors in a month and 300 make purchases, your conversion rate is 3%. This number tells you how effective your store is at turning browsers into buyers. Average Order Value (AOV) measures the typical revenue per transaction. If your total monthly revenue is $30,000 and you had 300 transactions, your AOV is $100. These two metrics work together because you can grow revenue by improving either one. You can increase conversion rate by simplifying checkout, or boost AOV through product bundling and strategic upsells. Customer Lifetime Value (CLV) represents the total profit a customer generates throughout their relationship with your store. A customer who makes five purchases averaging $100 each with a 40% profit margin generates $200 in lifetime value. This metric reveals which customer segments are most profitable long-term, helping you decide where to spend acquisition dollars.

Cart Abandonment Rate shows the percentage of visitors who add items to their cart but never complete checkout. High abandonment rates (often 60% to 80% for ecommerce) signal friction in your purchase process. Maybe your shipping costs surprise customers at checkout, or you require account creation before buying. Return on Ad Spend (ROAS) compares revenue generated from advertising against the cost of those ads. Spend $1,000 on Facebook ads and generate $5,000 in revenue, and your ROAS is 5:1. These metrics guide your budget decisions immediately. Understanding ecommerce sales data across industries shows that high performers consistently monitor these five metrics weekly. They track trends, identify drops, and respond quickly when numbers shift. Your store likely has additional metrics specific to your business, but master these five first. They connect directly to cash in your bank account.
Pro tip: Set up a simple spreadsheet or dashboard showing your five core metrics updated weekly, then schedule 15 minutes every Monday morning to review changes and spot trends before problems compound.
Data Types and Analysis Methods
Your analytics platform collects different types of data, and each type tells a different story about your customers and business. Understanding what you’re actually looking at prevents misinterpretation and helps you choose the right analysis method for each question you’re trying to answer. Think of data types like different ingredients in a recipe. You wouldn’t use salt the same way you use flour, and similarly, you wouldn’t analyze transaction data the same way you analyze behavioral data.
Transactional data is your most straightforward type. This includes purchase orders, order amounts, product IDs, customer IDs, dates, and payment methods. It answers questions like “How much did we sell this month?” and “Which products generate the most revenue?” Behavioral data captures what customers do on your site without necessarily buying. Page views, clicks, time spent, scroll depth, and product interactions fall here. This data reveals customer intent and engagement patterns. Customer demographic data includes information like location, age, device type, and traffic source. This lets you segment audiences and understand who’s actually buying versus just browsing. Transactional data collection methodologies form the backbone of international ecommerce measurement standards, ensuring consistency across how data is captured and reported globally.
Here’s a comparison of key ecommerce data types and the questions they help answer:
| Data Type | Example Information | Typical Questions Answered |
|---|---|---|
| Transactional Data | Order dates, product IDs | Which products sell best? |
| Behavioral Data | Clicks, time on page | Where do users drop off? |
| Demographic Data | Location, device, age | Who are my top buyers by region? |
| Value-based Data | Purchase frequency, total spend | Which customers generate most revenue? |
Your analysis methods depend on what questions you’re answering. Descriptive analytics looks at what happened in the past. You examine historical transaction data to calculate averages, totals, and trends. This is what you do when you review last month’s sales or compare this quarter to last quarter. Predictive analytics uses patterns in historical data to forecast what will happen next. If customers who buy product A also tend to buy product B within 30 days, predictive analysis can flag when a customer is likely to make that second purchase. Prescriptive analytics goes further by recommending specific actions. When your system identifies that a particular customer segment has high abandonment rates, it prescribes solutions like offering them a discount or simplifying checkout for that group. Most ecommerce store owners start with descriptive analytics, graduate to predictive when they have enough historical data, and eventually layer in prescriptive recommendations. Business analytics success factors emphasize that data management and decision integration determine whether analytics actually impacts your bottom line.
The practical reality: you likely won’t analyze all this data manually. Your tools do the heavy lifting. What matters is knowing which data type answers which question and understanding what your analysis actually means. When your platform shows a correlation between two products, that’s descriptive analytics at work. When it predicts a customer’s next purchase, that’s predictive. When it recommends bundling products together to increase AOV, that’s prescriptive. Recognizing these differences helps you trust the recommendations and act on them faster.
Pro tip: Start by mapping your top three business questions to specific data types. For example, “How do I increase AOV?” requires transactional and behavioral data analyzed predictively, while “Which customers are at risk of leaving?” needs CLV data and prescriptive analysis.
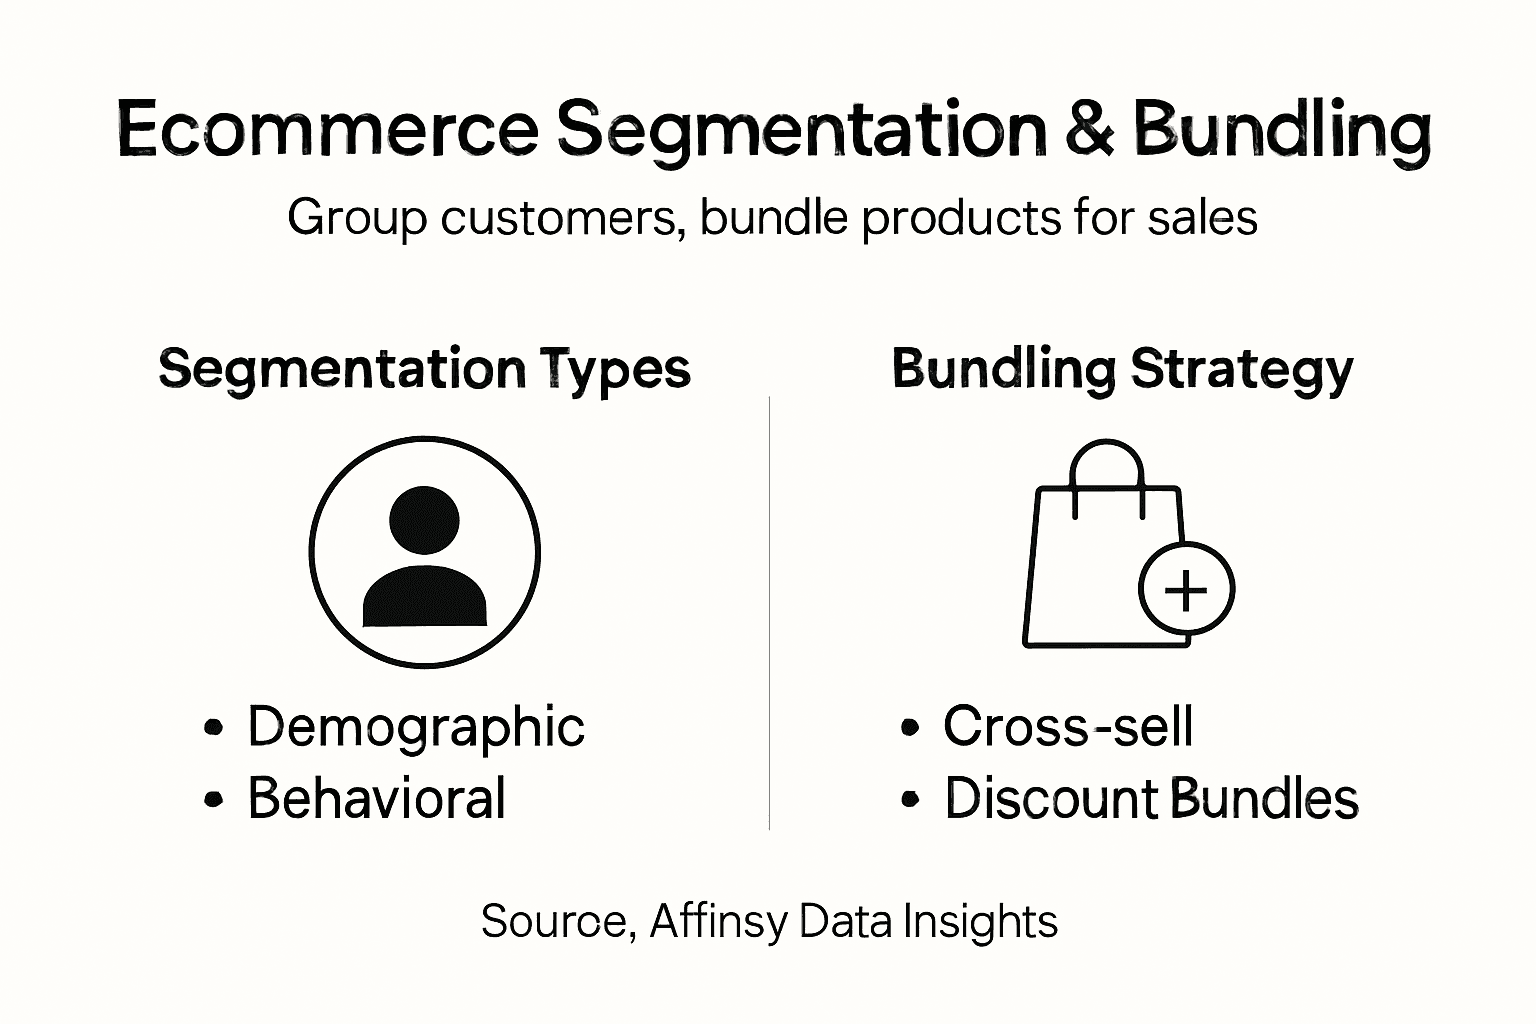
Customer Segmentation and Product Bundling Terms
Customer segmentation and product bundling work together as a powerful combination. You can’t bundle products effectively without understanding which customers want them, and you can’t segment customers intelligently without knowing what products they naturally want together. These two concepts are intertwined, so let’s break down what each term really means and how they connect to your revenue growth.
Customer segmentation means dividing your customer base into distinct groups based on shared characteristics. These characteristics can be demographic (age, location, device type), behavioral (purchase history, browsing patterns, cart abandonment), or value-based (high spenders versus window shoppers). When you segment, you’re essentially asking: who are my different types of customers? A clothing store might segment customers into athletic wear buyers, casual fashion buyers, and formal wear buyers. Each segment behaves differently, responds to different marketing, and likely wants different product combinations. Customer segmentation using analytics helps businesses identify which groups are most profitable and which need targeted interventions to prevent churn. RFM segmentation, which stands for Recency, Frequency, and Monetary value, is one of the most practical methods. It categorizes customers by how recently they purchased, how often they buy, and how much they spend. A customer who bought last week, buys monthly, and spends $500 per transaction belongs in a very different segment than someone who bought six months ago and spent $50 total.
Here’s a quick reference for customer segmentation and bundling strategies:
| Segmentation Type | Example Criteria | Effective Bundling Strategy |
|---|---|---|
| Demographic | Age, location, device | Bundle based on local preferences |
| Behavioral | Browsing, cart actions | Bundle items frequently viewed together |
| Value-based | High-spenders, repeat customers | Create premium, high-margin bundles |
Product bundling is the strategy of combining multiple products into a single offering at a single price. You might bundle a phone with a screen protector and charging cable, or a shampoo with conditioner and hair mask. Bundling works because it increases average order value, moves slower-selling items alongside popular ones, and creates perceived value for customers. The magic happens when you bundle based on segmentation. If your athletic wear segment tends to buy shoes and performance socks together, you create a bundle specifically for them. If your formal wear segment buys dresses and clutches together, that becomes a different bundle. Retail analytics approaches show that successful bundling targets specific customer groups rather than applying a one-size-fits-all approach to your entire store.
Here’s the practical application: you find that customers in your high-value segment (RFM analysis shows they spend $2,000 annually) frequently purchase premium skincare products. You create a “luxury skincare bundle” at a 15 percent discount that includes three items they typically buy separately. Your conversion rate jumps because the bundle feels like a deal, your AOV increases because customers add it to cart as a unit, and your inventory moves faster because slow sellers are bundled with bestsellers. This isn’t guessing. You’re using data from customer segmentation to inform your bundling strategy, which directly impacts revenue.
Pro tip: Analyze your top 20 percent of customers by revenue, identify what products they buy together, then create bundles based on those natural pairings rather than inventing combinations you think might work.
Common Mistakes and Misinterpretations
Even with the best analytics tools at your fingertips, store owners regularly make the same mistakes when interpreting their data. These aren’t small errors that cost you a few dollars. They’re strategic missteps that send you chasing the wrong opportunities while ignoring the real drivers of growth. Understanding what not to do is just as valuable as knowing what to do.
The biggest mistake is chasing vanity metrics. Page views, total visitors, and social media followers look impressive in reports, but they don’t directly correlate to revenue. You might celebrate hitting 100,000 monthly visitors without noticing your conversion rate dropped from 3 percent to 1.5 percent. That’s 100,000 visitors generating less revenue than 33,000 used to. Traffic without conversion is noise. Similarly, many store owners misinterpret correlation as causation. You notice that customers who viewed your blog had higher AOV, so you assume the blog caused the increase. The reality might be that high-intent customers naturally visit your blog before buying, but they were already going to spend that money regardless. Common analytics implementation pitfalls show that misaligning metrics with actual business objectives consistently leads to wasted resources and missed growth opportunities.
Another dangerous mistake involves ignoring customer context. A 10 percent increase in sales looks fantastic until you realize it came from your lowest-margin product category. Your AOV went up, but your profit margin went down because you’re selling more volume of items with 20 percent margins instead of 40 percent margins. Context matters. You also misinterpret seasonal spikes as trends. December sales spike for most retail, but if you mistake this for a real trend change, you over-invest in inventory for January and get stuck with excess stock. You need to compare year-over-year or account for seasonality explicitly. Over-reliance on vanity metrics and failure to examine data within proper customer journey context lead to decisions that feel data-driven but actually damage profitability.
Here’s what actually happens when you make these mistakes: you’re walking on a treadmill running faster and faster, thinking you’re getting somewhere because the dashboard shows movement. You implement changes based on misleading metrics, watch them fail, then make different changes without understanding why the first ones didn’t work. You never build momentum because you’re responding to noise instead of signal. The fix requires discipline. Always ask yourself three questions before acting on a metric: Does this metric connect directly to revenue? Am I looking at this number in the right context? Could I be misreading a correlation as causation? If you can’t answer yes to all three, wait for more data.
Pro tip: Create a “metric reality check” document listing your 10 core metrics alongside what business outcome each one actually drives, then reference it before making any strategic decision based on analytics.
Transform Ecommerce Analytics Into Actionable Growth
Many online retailers struggle to turn complex ecommerce analytics terminology into real revenue gains. Metrics like conversion rate, average order value, and customer lifetime value are crucial but can feel overwhelming without the right tools to analyze transaction data and customer segmentation effectively. If you find yourself stuck interpreting raw data or unsure how to optimize product bundling and cross-selling based on customer behavior, you are not alone.
Affinsy is designed to eliminate this confusion. Our AI-powered platform uncovers hidden product associations through market basket analysis and segments your customers using proven RFM techniques. This means you get clear, actionable insights to increase average order value and improve customer retention without needing advanced data science skills. Seamlessly connecting with Shopify, WooCommerce, and Google Analytics, Affinsy automates reporting and delivers the exact intelligence ecommerce store owners and marketing managers need to unlock sustainable growth.
Discover how to move beyond vanity metrics and make data-driven decisions that truly impact your bottom line.
Ready to turn your ecommerce analytics knowledge into measurable sales growth Visit Affinsy today to start leveraging AI-powered insights for smarter product bundling and targeted customer segmentation. Don’t wait to maximize your store’s potential and drive higher revenue with confidence.
Frequently Asked Questions
What is ecommerce analytics and why is it important?
Ecommerce analytics is the systematic measurement and analysis of customer interactions across your online store. It helps optimize your business by providing insights into customer behavior, sales performance, and traffic sources.
What are the core metrics to track in ecommerce analytics?
The core metrics include Conversion Rate, Average Order Value (AOV), Customer Lifetime Value (CLV), Cart Abandonment Rate, and Return on Ad Spend (ROAS). These metrics provide critical insights into revenue and customer relationships.
How can customer segmentation improve my ecommerce strategy?
Customer segmentation involves dividing your customer base into groups based on shared characteristics. This allows you to tailor marketing efforts and product offerings to meet the specific needs of different customer segments, leading to increased conversion rates and customer satisfaction.
What are common mistakes to avoid in ecommerce analytics?
Common mistakes include chasing vanity metrics, misinterpreting correlation as causation, ignoring customer context, and misreading seasonal spikes. These errors can lead to poor strategic decisions and missed growth opportunities.
Recommended
- Understanding Ecommerce Analytics Terminology for Retail - Affinsy Blog | Affinsy
- Understanding Ecommerce Analytics: Unlocking Insights - Affinsy Blog | Affinsy
- Why Ecommerce Analytics Matter for Online Retailers - Affinsy Blog | Affinsy
- Actionable Ecommerce Analytics Explained: Boost Revenue - Affinsy Blog | Affinsy