
Finding ways to boost long-term sales and customer loyalty often comes down to understanding what shoppers really want. For E-commerce managers, connecting sales systems with analytics platforms is the first step toward extracting real business intelligence. By using actionable data, you can uncover which product bundles resonate most and which strategies keep customers coming back. This overview equips you with practical steps to transform your data into strategies that support growth and retention.
Table of Contents
- Step 1: Connect Your Ecommerce And Analytics Platforms
- Step 2: Select Key Metrics For Product And Customer Analysis
- Step 3: Generate Actionable Reports Using Automated Tools
- Step 4: Interpret Insights To Optimize Product Bundling
- Step 5: Apply Data-Driven Strategies And Monitor Results
Quick Summary
| Key Insight | Explanation |
|---|---|
| 1. Connect Ecommerce and Analytics | Integrating these platforms allows real-time tracking of sales and customer behavior, transforming data into strategic insights for growth. |
| 2. Focus on Key Performance Metrics | Identifying and monitoring specific metrics like conversion rate and customer lifetime value directly informs business decisions. |
| 3. Use Automated Reporting Tools | Automating reports streamlines data analysis, ensuring timely access to insights, and allowing for quick decision-making. |
| 4. Analyze Product Bundling Strategies | Examining sales data for product associations helps create effective bundles that enhance sales and customer satisfaction. |
| 5. Implement Data-Driven Strategies | Establishing a systematic approach to analyze performance metrics enables strategic adjustments that drive growth and efficiency. |
Step 1: Connect Your Ecommerce and Analytics Platforms
Connecting your ecommerce platform with analytics tools unlocks powerful insights into your online store’s performance. This process enables you to transform raw transaction data into strategic business intelligence by creating seamless data pipelines between your sales systems and reporting platforms.
To begin integration, first identify the specific analytics platform compatible with your ecommerce system. Most modern platforms like Google Analytics, Shopify Analytics, and specialized tools offer direct connection options through API integrations or native plugins. Ecommerce data integration allows you to track crucial metrics such as conversion rates, customer behavior, and revenue attribution in real time. This means you can automatically sync transaction records, user interactions, and sales funnel data without manual export or complex data manipulation.
Start by accessing your ecommerce platform’s settings menu and locating the analytics or integration section. You will typically need to generate an API key or authentication token that allows the two systems to communicate securely. Some platforms offer one-click connections, while others might require manual configuration of data mapping and synchronization frequency.
Pro Tip: Before finalizing your integration, run a test synchronization to ensure data flows correctly and verify that all critical metrics are being captured accurately.
Step 2: Select Key Metrics for Product and Customer Analysis
Selecting the right metrics is crucial for understanding your ecommerce store’s performance and driving strategic growth. By focusing on specific, actionable indicators, you can gain deep insights into customer behavior, product performance, and overall business health.

Begin by identifying key performance indicators in product analytics that align with your business goals. Essential metrics include customer retention rate, churn rate, conversion rate, average order value, and customer lifetime value. These indicators help you understand how customers interact with your products, where they drop off in the purchasing journey, and which segments generate the most revenue. Pay special attention to metrics that reveal customer engagement patterns such as repeat purchase rate, product adoption speed, and feature usage frequency.
To effectively track these metrics, leverage analytics platforms that offer comprehensive dashboards and customizable reporting. Segment your data by customer demographics, purchase history, and product categories to uncover nuanced insights. Look for patterns that reveal your most valuable customer segments, highest performing products, and potential areas for improvement in your sales funnel.
Here is a summary of key analytics metrics and the business decisions they inform:
| Metric | Business Decision Enabled | Benefit to Store |
|---|---|---|
| Conversion Rate | Evaluate sales funnel changes | Focus marketing investment |
| Customer Lifetime Value | Tailor loyalty and retention plans | Maximize long-term revenue |
| Average Order Value | Optimize cross-sell and bundling | Increase per-purchase profit |
| Repeat Purchase Rate | Refine replenishment campaigns | Enhance customer loyalty |
Pro Tip: Create a core dashboard with 5-7 critical metrics that directly impact your business growth, and review these weekly to maintain a pulse on your store’s performance.
Step 3: Generate Actionable Reports Using Automated Tools
Automated reporting transforms raw data into strategic insights, enabling you to make informed decisions quickly and efficiently for your ecommerce business. By leveraging advanced technological solutions, you can streamline your analytics process and extract meaningful performance indicators.
Automated report generation uses AI powered tools that extract relevant data, structure information coherently, and customize outputs for specific business needs. Modern analytics platforms offer drag and drop interfaces that allow you to create comprehensive reports without extensive technical expertise. Select tools that integrate seamlessly with your existing ecommerce and analytics platforms, focusing on features like real time data synchronization, customizable dashboards, and automated scheduling.
When selecting an automated reporting tool, prioritize platforms that offer visual data representation, predictive analytics capabilities, and export options in multiple formats. Configure your reports to highlight key performance metrics such as conversion rates, customer acquisition costs, average order value, and customer lifetime value. Ensure the tool provides drill down capabilities that allow you to explore granular details behind each metric, helping you understand the underlying trends driving your business performance.
Compare different reporting automation features for ecommerce analytics:
| Feature | Benefit | Implementation Challenge |
|---|---|---|
| Real-time Data Sync | Always up-to-date insights | Integration with all sources |
| Custom Dashboards | Focus on business goals | Requires setup and maintenance |
| AI-driven Insights | Identify hidden trends | Needs quality input data |
| Scheduled Reports | Save staff time | Timing configuration required |
Pro Tip: Schedule automated report generation during off peak hours to minimize system load and ensure your most critical business insights are ready first thing in the morning.
Step 4: Interpret Insights to Optimize Product Bundling
Interpreting analytics data is crucial for creating strategic product bundles that drive higher sales and improve customer experience. By carefully analyzing your performance metrics, you can develop targeted bundling strategies that resonate with your customers.
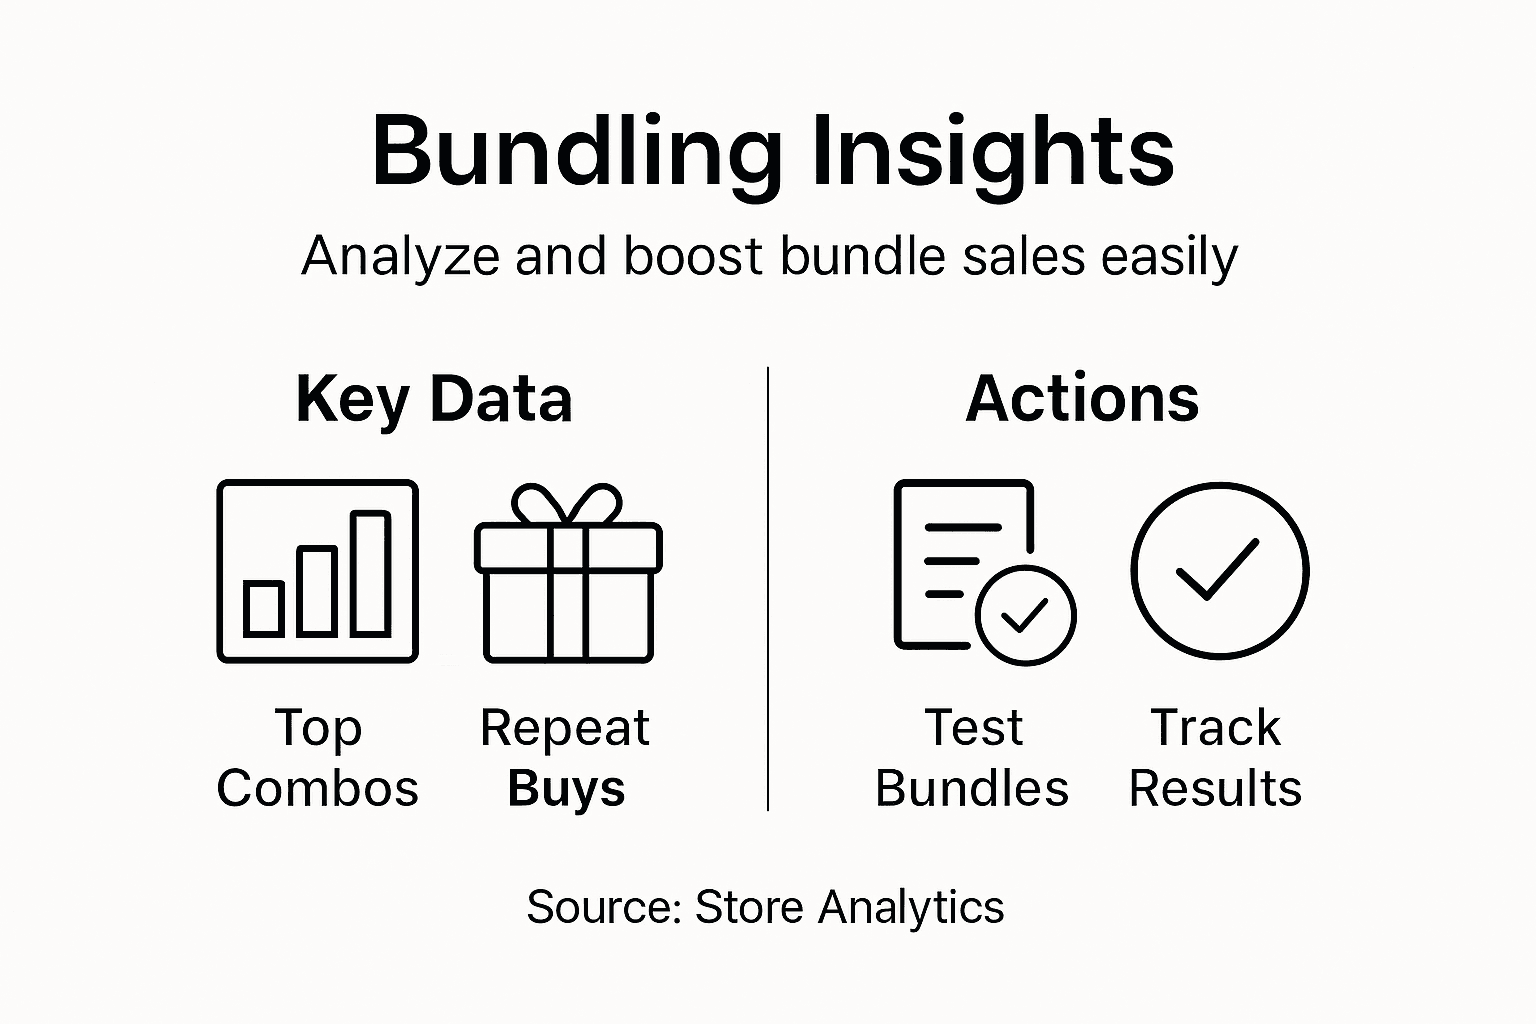
Product bundling research reveals complex relationships between user preferences, product characteristics, and bundle effectiveness. Start by examining your historical sales data to identify natural product associations customers frequently purchase together. Look for patterns in transaction histories such as complementary items, repeat purchase combinations, and cross category buying behaviors. Pay special attention to metrics like combined purchase frequency, average bundle value, and customer segments most likely to engage with specific product combinations.
Dive deep into your analytics by segmenting bundle performance across different customer demographics, seasonality, and product categories. Create visualization tools that help you quickly understand which bundles generate the highest profit margins and customer satisfaction. Analyze metrics such as bundle conversion rates, average order value increase, and customer retention improvements to validate your bundling hypotheses and continuously refine your strategy.
Pro Tip: Test small bundle variations systematically and track their individual performance to incrementally optimize your product combination strategies.
Step 5: Apply Data-Driven Strategies and Monitor Results
Transforming your ecommerce analytics into actionable strategies requires a systematic approach that links insights directly to operational improvements. By developing a structured methodology, you can turn raw data into meaningful business growth opportunities.
Data-driven strategies involve collecting accurate, complete information to guide precise decision making. Begin by establishing a baseline of key performance indicators that reflect your specific business objectives, such as conversion rates, customer acquisition costs, average order value, and customer lifetime value. Create a dashboard that tracks these metrics in real time, allowing you to quickly identify trends, anomalies, and opportunities for optimization.
Implement a continuous improvement cycle where you regularly review performance data, develop hypotheses about potential improvements, and run controlled experiments to validate your strategies. This might include A/B testing product bundles, adjusting pricing strategies, or refining marketing approaches based on customer segment performance. Ensure you have a robust tracking mechanism that allows you to measure the direct impact of each strategic adjustment, providing clear evidence of what works and what needs further refinement.
Pro Tip: Schedule monthly strategy review sessions where you critically analyze your data-driven insights and align them with your broader business goals.
Unlock Ecommerce Growth With Smarter Analytics
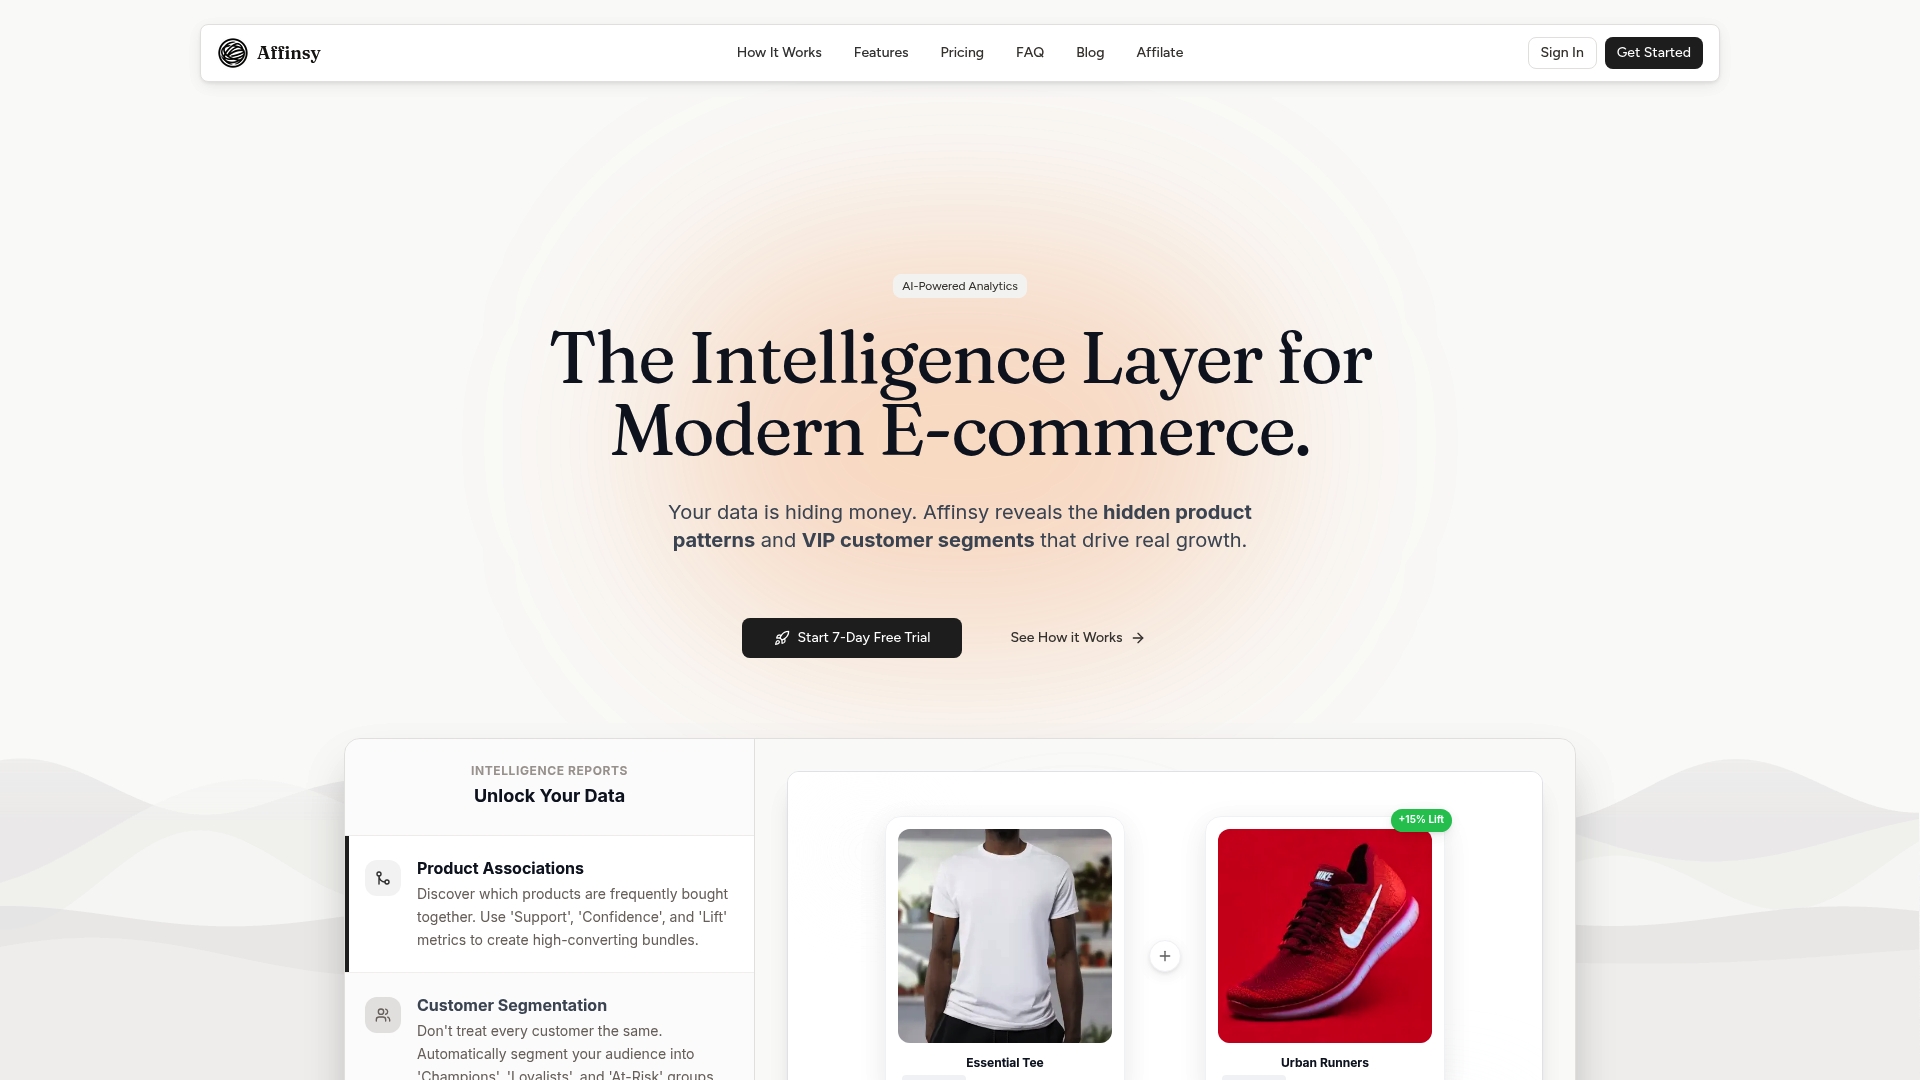
The challenge of transforming raw sales data into actionable strategies can feel overwhelming. This article highlights common pain points including tracking key metrics like conversion rate and customer lifetime value and generating automated reports to optimize product bundling and retention. If you are searching for a way to effortlessly interpret these insights and implement data-driven decisions you need tools that go beyond basic analytics.
Affinsy offers exactly that solution. By leveraging AI-powered analytics, our SaaS platform dives deep into your ecommerce transaction history to uncover hidden product associations and customer segments. This means you can optimize product bundles and cross-selling strategies with market basket analysis and RFM customer segmentation without requiring advanced data science skills. Seamless integration with Shopify, WooCommerce, and Google Analytics makes setup easy and lets you generate customizable reports with advanced dashboards tailored to your growth goals.
Are you ready to maximize your average order values increase customer loyalty and fuel store expansion? Start now and experience how Affinsy’s AI-driven insights simplify ecommerce reporting and strategic decision-making.
Boost your ecommerce performance today Explore Affinsy and learn how to turn analytics into profit.
Frequently Asked Questions
How do I connect my ecommerce and analytics platforms?
Connecting your ecommerce platform and analytics tools is essential for gaining insights. Start by accessing your ecommerce settings menu, locate the integration section, and generate an API key or authentication token to establish communication between the two systems. Ensure you run a test synchronization to confirm data accuracy.
What key metrics should I track for my ecommerce store?
Focus on metrics such as conversion rate, customer lifetime value, and average order value to optimize your store’s performance. Identify these key performance indicators in alignment with your business goals, and review them weekly to adjust your strategies based on customer behavior patterns.
How can I generate automated reports for my ecommerce analytics?
Automated reporting can streamline your data analysis process by extracting relevant information in real-time. Choose a reporting tool that integrates with your existing systems, configure it to highlight your critical metrics, and schedule report generation during off-peak hours to ensure timely delivery each day.
How do I interpret analytics insights to improve product bundling?
Analyze your sales data to identify which products are frequently purchased together, focusing on complementary items and customer preferences. Use metrics like combined purchase frequency and bundle conversion rates to test different product combinations, optimizing your offerings incrementally based on performance results.
What strategies can I apply based on my ecommerce data?
Implement data-driven strategies by establishing a baseline of key performance indicators and regularly reviewing them. Create a dashboard to track metrics in real time, and run controlled experiments, such as A/B testing different pricing strategies, to validate your adjustments and drive growth efficiently.
Recommended
- E Commerce Analysis Report Guide for 2025 Success - Affinsy Blog | Affinsy
- Advertise My Store Guide: Proven Strategies for 2025 Success - Affinsy Blog | Affinsy
- Understanding Ecommerce Growth Strategies Guide - Affinsy Blog | Affinsy
- 10 Ecommerce Tips to Elevate Your Online Store in 2025 - Affinsy Blog | Affinsy