
Finding ways to turn raw sales numbers into practical growth strategies can feel like exploring a maze for many E-commerce managers. Accurate data transforms everyday transactions into tailored product bundles and improved customer retention. By leveraging sales data insights, you gain a reliable foundation for smarter decision-making. This article lays out proven concepts and analytics that help you uncover profitable product combinations and identify valuable repeat buyers, setting the stage for lasting success.
Table of Contents
- Sales Data Insights And Core Concepts
- Types Of Sales Data In E-Commerce
- Unlocking Hidden Patterns With Analytics
- Actionable Applications For Retail Growth
- Risks, Challenges, And Best Practices
Key Takeaways
| Point | Details |
|---|---|
| Sales Data Insights | Sales data transforms raw numbers into actionable strategies, driving better business decisions and revenue growth. |
| Types of Sales Data | Different data types, including transactional, customer, website analytics, and market research, provide essential insights for informed decision-making. |
| Pattern Discovery in Analytics | Applying sophisticated analytics reveals hidden patterns that can improve product bundling and retention strategies. |
| Data Quality Management | Ensuring data quality and integration is crucial for reliable analytics; poor data leads to misguided decisions and inefficiencies. |
Sales Data Insights and Core Concepts
Sales data insights are the foundation of every smart e-commerce decision you make. They transform raw transaction numbers into actionable strategies that directly impact your bottom line.
At its core, sales data captures quantifiable information from your sales activities. This includes deals closed, conversion rates, sales cycle length, and customer purchase patterns that connect directly to revenue outcomes.
Why does this matter? Because the difference between guessing and knowing is the difference between steady growth and competitive advantage. When you understand your data, you can allocate resources smarter.
Market intelligence plays a crucial role here. Collecting data about market trends, consumer behavior, and competitor activity provides the context your sales data needs. It’s the bigger picture that makes individual metrics meaningful.
Here’s what sales data insights actually cover:
- Trend spotting: Identifying patterns in customer behavior and purchase cycles over time
- Segmentation: Grouping customers by shared characteristics like spending habits or product preferences
- Cohort analysis: Comparing groups of customers who made purchases during specific timeframes
- Predictive modeling: Using historical data to forecast future customer behavior and revenue opportunities
These analytical approaches work together. When you combine sales data analysis techniques with proper data visualization, patterns that were hidden in spreadsheets suddenly become obvious.
Compare analytics approaches and see how each advances e-commerce growth:
| Analytics Method | Main Focus | Typical Outcome |
|---|---|---|
| Trend Spotting | Customer behavior over time | Identifies sales peaks and low periods |
| Segmentation | Grouping by shared attributes | Reveals high-value target audiences |
| Predictive Modeling | Forecasting future behaviors | Informs inventory and campaign planning |
| Cohort Analysis | Comparing customer timeframes | Highlights lifecycle and repeat rates |
For e-commerce managers specifically, this means understanding which product combinations drive higher order values, which customer segments have the highest lifetime value, and which retention strategies actually work.
Your sales data also reveals untapped opportunities. Maybe customers who buy Product A usually buy Product B within 30 days. That’s not luck—that’s a bundling opportunity worth thousands in additional revenue.
Sales data transforms from numbers on a screen into competitive intelligence the moment you start asking the right questions.
The relationship between your sales activities and revenue outcomes isn’t mysterious. It’s measurable, trackable, and repeatable.
Pro tip: Start by auditing what sales data you’re already capturing. Most mid-sized retailers have richer data than they realize—they just haven’t organized it to reveal insights yet.
Types of Sales Data in E-Commerce
Not all data is created equal. Your sales data comes in different forms, and each tells a different story about your business.
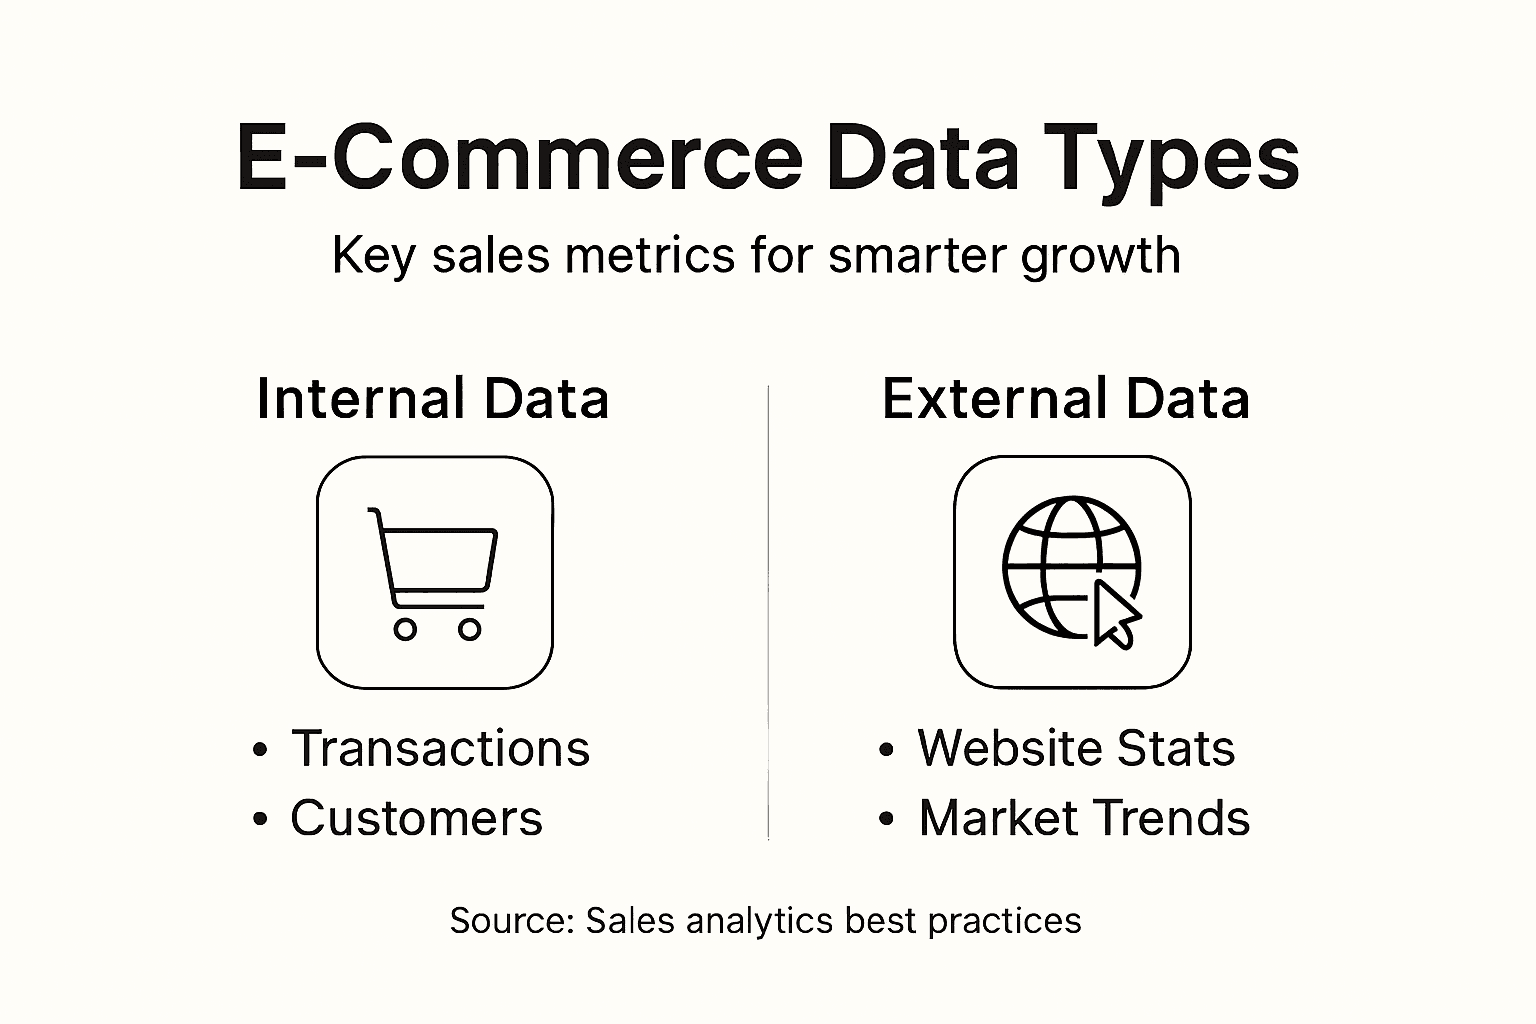
Transactional data is your most straightforward sales metric. It captures what customers bought, when they bought it, how much they spent, and which channel they used. This is the backbone of every sales analysis.

Customer data reveals who your buyers are. It includes their demographics, purchase history, browsing behavior, and contact preferences. Understanding your customer profile helps you segment audiences for targeted strategies.
Website analytics data tracks how visitors move through your store. This includes page views, bounce rates, time on site, click paths, and conversion funnels. These metrics show you where customers drop off and where they convert.
Market research data provides context outside your own store. It includes competitor pricing, industry trends, seasonal patterns, and customer sentiment from reviews. This external view helps you position your products strategically.
Here’s a summary comparison of the main e-commerce sales data types and how each benefits your business:
| Data Type | Key Information Captured | Business Impact |
|---|---|---|
| Transactional Data | Purchases, amounts, timestamps, channels | Tracks actual revenue and buying trends |
| Customer Data | Demographics, history, preferences | Enables targeted marketing and segmentation |
| Website Analytics | Page views, click paths, conversion rates | Reveals funnel bottlenecks and site strengths |
| Market Research | Competitor pricing, reviews, industry trends | Informs positioning and product strategy |
Here’s how these data types break down by category:
- Behavioral data: Customer actions like clicks, purchases, cart abandonment, and browsing patterns
- Descriptive data: Customer attributes like location, age, company size, and purchase frequency
- Transactional data: Specific purchase details including product, price, quantity, and timestamp
- Performance data: Channel metrics showing revenue by source, platform, or marketing campaign
When analyzing your e-commerce business, e-sales turnover through various channels becomes increasingly important. You need to understand not just total revenue, but which sales channels generate the most profit.
The magic happens when you combine these data types. Transactional data tells you what sold. Customer data shows who bought it. Website analytics reveal how they discovered it. Market research explains why that combination works.
Your complete sales picture requires multiple data types working together, not just one source analyzed in isolation.
For e-commerce managers managing product bundling and retention strategies, this means you need access to all four data types simultaneously. When you see which product combinations drive higher order values and which customer segments repeat purchase most often, you’re combining transactional, customer, and behavioral data.
Pro tip: Before implementing new analytics tools, audit which data types you’re already collecting but not yet using. Most retailers have valuable customer and behavioral data sitting unused in their existing platforms.
Unlocking Hidden Patterns with Analytics
Your sales data contains secrets. Most e-commerce managers never discover them because they’re looking at surface-level metrics instead of digging deeper.
Pattern discovery is what separates growing retailers from stagnant ones. When you apply sophisticated analytics to your transaction history, you reveal relationships between products, customer behaviors, and revenue drivers that were invisible before.
Consider this real scenario. You notice that customers purchasing Product A have a 67% likelihood of buying Product B within 14 days. That’s not coincidence. That’s a bundling opportunity worth thousands in additional revenue. But you only find it through systematic analysis.
Big data analytics reveals hidden patterns that drive innovation in e-commerce. When you analyze large datasets across customer behavior, purchase history, and market trends, actionable insights emerge about what actually drives sales.
Here’s what hidden pattern analysis uncovers:
- Product associations: Which items customers buy together, even across different categories
- Customer segments: Groups with similar buying behaviors, lifetime values, or retention rates
- Seasonal patterns: Demand fluctuations tied to specific months, holidays, or events
- Price sensitivity: How different customer groups respond to discounts and promotions
- Churn indicators: Behavioral signals that predict which customers will stop purchasing
Machine learning models enhance this process dramatically. Instead of manually reviewing thousands of transactions, algorithms identify patterns instantly and with remarkable accuracy.
Predictive AI in sales forecasting uncovers hidden sales patterns that improve demand planning. These models learn from historical data and predict future customer behavior with high precision, enabling smarter inventory and bundling decisions.
For e-commerce managers specifically, this means understanding which customer segments have the highest lifetime value, which product combinations drive the biggest order value increases, and which retention strategies actually work for your specific audience.
Hidden patterns only stay hidden if you never look for them. Analytics transforms your data from historical records into a predictive asset.
The difference between guessing and knowing is analytics. You stop making assumptions about what customers want and start making decisions based on what your data proves they actually buy.
Pro tip: Start with your highest-performing customer segment. Analyze their purchase patterns in detail, identify what makes them different, then replicate those characteristics in your acquisition and retention strategies.
Actionable Applications for Retail Growth
Knowing your data exists is one thing. Actually using it to make better decisions is another entirely.
Actionable applications transform insights into revenue. This means taking what you learned from analytics and implementing specific, measurable changes to your business operations.
Start with product bundling optimization. Your sales data reveals which products customers buy together. Use that to create bundles that increase average order value. A customer buying Product A alone generates one sale. A customer buying Products A and B together generates higher revenue and stronger customer lifetime value.
Customer retention strategies become data-driven when you segment your audience. Instead of one-size-fits-all approaches, you tailor offers and messaging based on actual customer behavior patterns. High-value repeat customers get different treatment than one-time buyers.
Real-time data analytics unlocks strategic customer insights that enhance decision-making. When you apply these insights to personalized marketing and inventory management, you improve both customer engagement and operational efficiency.
Here are concrete applications for your retail business:
- Inventory optimization: Stock what your data proves customers actually want, reducing carrying costs
- Personalized marketing: Send targeted offers based on purchase history and browsing behavior
- Dynamic pricing: Adjust prices strategically for different customer segments and seasonal demand
- Churn prevention: Identify at-risk customers and intervene with retention offers before they leave
- Channel allocation: Direct marketing budget to channels that actually convert for your business
Omnichannel retail operations generate vast data from point-of-sale systems, loyalty programs, and customer touchpoints. Leveraging this data across all channels enables smarter planning and growth initiatives that improve both online and offline performance.
For e-commerce managers managing product bundling and retention, this means using your transaction data to identify which bundle combinations drive the highest margins, which customer segments repeat purchase most often, and which messaging resonates with each audience.
Analytics without action is just curiosity. Actionable applications transform curiosity into competitive advantage.
The real power comes from integration. Your bundling strategy improves when supported by targeted retention campaigns. Your retention improves when bundling increases perceived value. Your pricing improves when segmentation reveals what different customers will actually pay.
Pro tip: Pick one actionable application and measure it rigorously before moving to the next. Track baseline metrics, implement the change, then measure results after 30 days. This prevents analysis paralysis and proves ROI to stakeholders.
Risks, Challenges, and Best Practices
Data is powerful. Data mishandled is dangerous. The difference between success and costly mistakes comes down to how seriously you take data management.
Data quality issues are the silent killer of analytics programs. Garbage in, garbage out. If your transactional data contains errors, duplicate records, or inconsistent formatting, your insights become unreliable and your decisions become risky.
Data integration presents real obstacles. When your sales data comes from Shopify, your customer data from email marketing, and your analytics from Google, connecting them cleanly becomes complex. Sales data management faces risks from inconsistent data across multiple sources. Integration difficulties create data silos where insights stay trapped in separate systems instead of fueling unified strategy.
Common challenges you’ll face include:
- Data silos: Information trapped in separate platforms that never communicate
- Inconsistent formatting: Product names spelled differently across systems
- Duplicate records: Same customer counted multiple times with different identifiers
- Missing values: Incomplete transaction records that skew analysis
- User adoption: Teams resistant to data-driven decision-making processes
Common challenges in sales analytics include data integration issues and user adoption barriers. Sales leaders mitigate these by broadening analytics scope, enhancing team structures, and implementing probabilistic forecasting approaches.
Best practices protect your analytics investment. Start by implementing consistent data validation procedures. Every transaction entering your system should pass standardized checks. Define what valid data looks like, then automate the validation process.
Automated data cleansing tools save time and improve accuracy. Instead of manually reviewing thousands of records, tools flag anomalies and inconsistencies automatically, freeing your team for strategic work.
Foster data trust across your organization. When teams believe data is accurate and representative, they use it. When they suspect errors, they ignore it. Transparency about your data sources and quality standards builds confidence.
Poor data quality costs more than the cost of fixing it. One bad decision made on faulty data often exceeds the entire investment in data governance.
Document your processes. When your data validation procedures live only in someone’s head, you’re vulnerable. Write down how you define metrics, clean data, and handle exceptions.
Pro tip: Start your data governance journey with your highest-impact metrics. Don’t try to perfect everything simultaneously. Focus on the three metrics that drive the most important business decisions, ensure those are bulletproof, then expand from there.
Unlock the Full Potential of Your Sales Data with Affinsy
The challenge many e-commerce managers face is turning complex sales data into actionable growth strategies. This article highlights the critical need to uncover hidden product associations and customer segments to optimize bundling, retention, and overall revenue. If you want to stop guessing and start knowing which products drive higher order values and which customer behaviors predict future purchases then leveraging sophisticated analytics is essential.
Affinsy is a powerful SaaS platform designed specifically for online retailers who want to harness their historical transaction data without requiring advanced data science skills. By integrating seamlessly with Shopify, WooCommerce, and Google Analytics it reveals market basket analysis and RFM segmentation patterns that empower you to make data-driven decisions with confidence.

Discover how to maximize your e-commerce growth by using AI-powered insights from Affinsy. Start now to optimize product bundling, improve customer retention, and increase average order values with a tool built to unlock the hidden power in your sales data. Visit Affinsy today and take the first step toward smarter analytics that drive real results.
Frequently Asked Questions
What is sales data and why is it important for e-commerce?
Sales data captures quantifiable information from sales activities, including deals closed, conversion rates, and customer purchase patterns. It is crucial for making informed e-commerce decisions that can lead to steady growth and a competitive advantage.
How can I use sales data to improve my product bundling strategy?
Analyze your sales data to identify which products are commonly purchased together. By offering these items as bundles, you can increase average order value and enhance customer lifetime value.
What types of sales data should I focus on for better insights?
You should concentrate on transactional data, customer data, website analytics, and market research data. Each type offers unique insights about customer behavior, purchasing trends, and opportunities for strategic improvement.
How can pattern discovery in sales data lead to business growth?
Pattern discovery reveals hidden relationships between products, customer behaviors, and revenue drivers. By identifying these patterns, businesses can implement targeted marketing and retention strategies that drive growth and increase sales.
Recommended
- Sales Data Analysis: Unlocking E-Commerce Growth - Affinsy Blog | Affinsy
- Data-Driven Ecommerce Strategies for Smarter Growth - Affinsy Blog | Affinsy
- Ecommerce Data Visualization for Sales Growth - Affinsy Blog | Affinsy
- Data Driven Ecommerce: Unlocking Revenue Potential - Affinsy Blog | Affinsy
- Start a Clothing Influencer Program That Sells – MEXESS