
E-commerce owners often miss revenue opportunities because they don’t understand what drives customer purchases. Without analyzing buying behavior, you’re essentially guessing which products to promote, when to reach out, and how to retain valuable customers. This guide walks you through proven methods to analyze customer purchase patterns in 2026, from foundational RFM segmentation to advanced techniques that reveal hidden opportunities. You’ll learn practical steps to segment customers, predict behavior, and create targeted strategies that increase both sales and customer lifetime value.
Table of Contents
- Understanding Customer Purchase Patterns And Preparing Your Data
- Applying RFM Analysis To Segment Customers Effectively
- Advanced Methods To Complement RFM And Enhance Purchase Pattern Insights
- Troubleshooting RFM Limitations And Optimizing Analysis Performance
- Boost Your Analysis With Affinsy’s E-Commerce Analytics Tools
- Frequently Asked Questions
Key takeaways
| Point | Details |
|---|---|
| RFM analysis segments customers | Score customers by recency, frequency, and monetary value to identify your most valuable segments and tailor marketing accordingly. |
| Combine multiple analysis methods | Pairing RFM with cohort analysis and market basket analysis reveals deeper insights into retention patterns and cross-selling opportunities. |
| Automate data refreshes weekly | Fresh data ensures your customer segments stay current and your marketing campaigns remain effective and timely. |
| Validate segments with business metrics | Check your RFM groups against customer lifetime value and churn rates to confirm they represent meaningful, actionable customer groups. |
| Machine learning enhances predictions | Advanced models like XGBoost predict future buying behavior with higher accuracy than RFM alone when you have sufficient data. |
Understanding customer purchase patterns and preparing your data
Customer purchase patterns reveal the underlying behaviors that drive revenue in your store. These patterns show you which customers buy frequently, who spends the most, and who’s at risk of leaving. Understanding these behaviors lets you allocate marketing resources efficiently and create personalized experiences that boost retention.
Before you can analyze anything, you need clean transaction data. Extract transaction data including customer ID, purchase date, and amount for 12 months as your foundation. Most e-commerce platforms like Shopify and WooCommerce make this export straightforward through their admin panels or API connections. Your dataset should include every completed order with at least these fields: unique customer identifier, transaction date, and total order value.
The RFM framework relies on three core metrics that quantify customer value. Recency measures days since the customer’s last purchase, showing engagement level. Frequency counts total purchases over your analysis period, indicating loyalty. Monetary value sums all spending, revealing revenue contribution. These three dimensions create a complete picture of each customer’s relationship with your store.
Data preparation involves several critical steps. First, filter out canceled or refunded orders to avoid skewing your analysis. Next, deduplicate any records where the same transaction appears multiple times. Then standardize date formats and currency values if you operate in multiple regions. Finally, handle missing customer IDs by either excluding those transactions or creating anonymous customer records if the volume is significant.
Pro Tip: Set up automated data extraction pipelines that refresh your analysis dataset weekly. Fresh data keeps your customer segments accurate and ensures your master RFM analysis ecommerce sales strategies respond to real-time behavioral changes rather than outdated patterns.
Applying RFM analysis to segment customers effectively
RFM analysis transforms raw transaction data into actionable customer segments. The methodology assigns numerical scores to each metric, then combines these scores to group customers by behavior. This quantitative approach removes guesswork and creates repeatable segmentation you can track over time.
Start by calculating each metric for every customer. For recency, subtract each customer’s most recent purchase date from your analysis date to get days elapsed. For frequency, count their total orders during your timeframe. For monetary value, sum all their order totals. Once you have these three numbers per customer, you’re ready to score.

Quantile scoring divides your customer base into five equal groups for each metric. RFM scores range from 1 to 5 using quantiles, with 5 representing the best performers. For recency, customers who purchased most recently get 5, while those with the oldest last purchase get 1. For frequency and monetary value, higher counts and spending receive higher scores. This relative scoring adapts automatically to your specific business scale.
Here’s how to implement the scoring process:
- Sort all customers by recency in ascending order and divide into five equal groups, assigning scores 5 to 1 from most to least recent.
- Repeat the process for frequency, sorting by purchase count in descending order and assigning 5 to the highest frequency group.
- Do the same for monetary value, with the highest spenders receiving 5 and lowest spenders receiving 1.
- Combine the three scores into a three-digit RFM code for each customer, like 543 or 221.
These combined scores create natural customer segments. Champions earn 555 or 554, representing your best customers who buy recently, frequently, and spend heavily. Loyal customers score high on frequency and monetary but may have moderate recency. At-Risk customers previously scored well but show declining recency scores. Lost customers score 111 or similar, indicating they haven’t purchased in a long time, bought infrequently, and spent little.
| Segment | RFM Score Range | Characteristics | Recommended Action |
|---|---|---|---|
| Champions | 555, 554, 544, 545 | Recent frequent buyers, high spend | Reward loyalty, early access to new products |
| Loyal | 543, 444, 435, 355 | Regular customers, consistent spend | Upsell premium items, referral programs |
| At-Risk | 244, 334, 343, 144 | Previously active, declining engagement | Win-back campaigns, special offers |
| Lost | 111, 112, 121, 211 | Inactive, low historical value | Low-cost reactivation or exclude from campaigns |
Pro Tip: Adjust metric weights based on your business model. Subscription businesses might weight recency heavily since engagement matters more than transaction count, while luxury retailers could prioritize monetary value over frequency. The RFM analysis framework is flexible enough to match your specific revenue drivers. Test different weighting schemes and validate results against actual customer segmentation ecommerce guide outcomes to find your optimal configuration.
Advanced methods to complement RFM and enhance purchase pattern insights
While RFM provides powerful customer segmentation, combining it with other analytical methods creates a multidimensional understanding of purchase behavior. These complementary techniques reveal patterns RFM alone cannot detect, particularly around product relationships and time-based trends.
Cohort analysis tracks groups of customers who share a common characteristic over time. Typically, you group customers by their first purchase month and then monitor their retention rates and spending patterns month by month. This reveals whether your newer customer cohorts are more or less valuable than older ones, and helps identify when customers typically churn. Cohort analysis answers questions like whether customers acquired through paid ads have better lifetime value than organic customers.
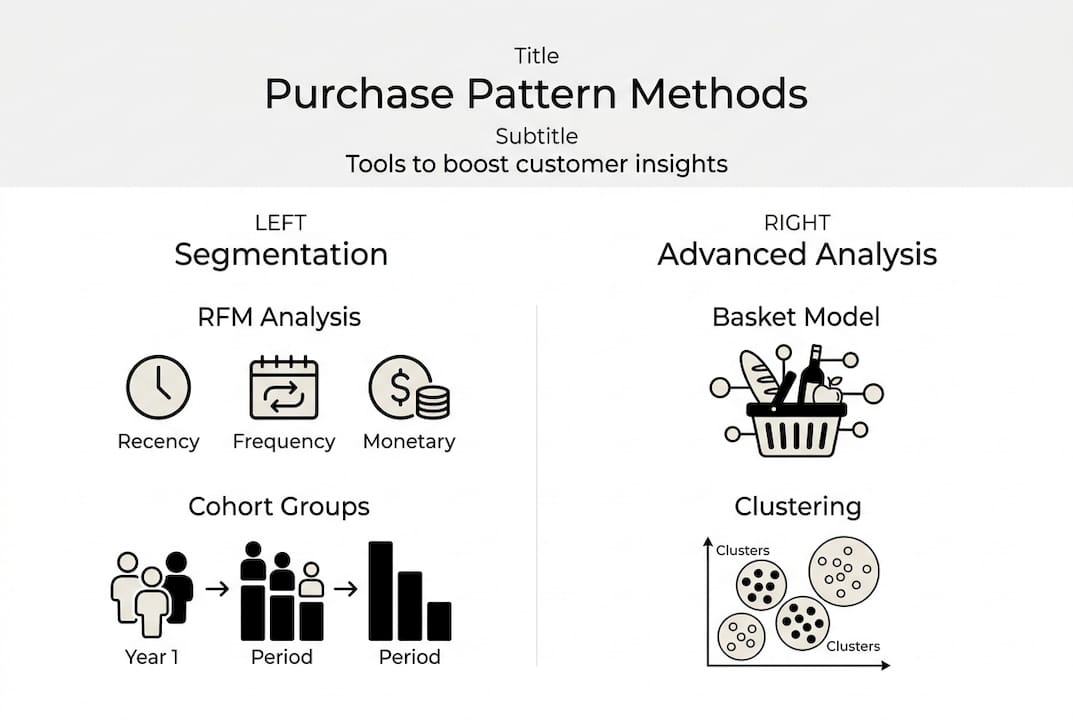
Market basket analysis discovers product co-purchase patterns, showing which items customers frequently buy together. This technique uses association rules to quantify relationships between products, measuring metrics like support (how often items appear together), confidence (likelihood of buying B given A), and lift (how much more likely the combination is than random chance). These insights drive product bundling strategies and cross-sell recommendations that increase average order value.
Clustering algorithms like K-Means provide an alternative to rule-based RFM segmentation. Instead of predefined score ranges, clustering algorithms mathematically group customers based on similarity across multiple dimensions. You can include dozens of features beyond RFM, such as product category preferences, browsing behavior, or geographic location. The algorithm identifies natural groupings in your data that might not align with traditional RFM segments but could be more meaningful for targeting.
Machine learning models take prediction to the next level. Techniques like CNN and XGBoost achieve high accuracy in forecasting customer behavior, including churn probability, next purchase date, and lifetime value. These models learn complex patterns from historical data and can incorporate hundreds of features simultaneously. However, they require larger datasets, technical expertise, and ongoing model maintenance that smaller operations may find challenging.
| Method | Ease of Implementation | Key Insights | Best Use Case |
|---|---|---|---|
| RFM Analysis | High | Customer value segments | Quick segmentation for targeted marketing |
| Cohort Analysis | Medium | Retention trends over time | Understanding customer lifecycle and acquisition quality |
| Market Basket | Medium | Product associations | Optimizing product bundles and cross-sells |
| Clustering | Low | Natural customer groups | Discovering unexpected segments with many features |
| Machine Learning | Very Low | Predictive accuracy | Large-scale operations with data science resources |
Pro Tip: Start with RFM and add one complementary method at a time. Combining market basket analysis with RFM segments lets you create hyper-targeted product recommendations for each customer group. For example, send Champions personalized bundles based on their purchase history, while offering At-Risk customers discounts on products frequently bought by similar Loyal customers. Track your e-commerce metrics to track for store growth to measure the incremental impact of each analytical layer you add. See practical applications in this market basket analysis example to understand implementation.
Troubleshooting RFM limitations and optimizing analysis performance
RFM analysis, while powerful, comes with limitations that can mislead your strategy if not addressed. Understanding these constraints helps you refine your approach and validate that your segments truly represent actionable customer groups.
Common pitfalls include arbitrary threshold selection, where you choose RFM score cutoffs without statistical justification. Using fixed score ranges like “Champions must be 555” ignores the relative nature of your customer base. If your entire customer base has low engagement, your “Champions” might still be mediocre compared to industry benchmarks. RFM has limitations with seasonal businesses, where purchase cycles naturally create long gaps between transactions that don’t indicate disengagement.
Another limitation involves ignoring customer tenure. A customer who joined last week and made one purchase might score identically to a five-year customer with the same recent single purchase, yet they represent vastly different relationships. New customers lack the purchase history to generate meaningful frequency and monetary scores, making their RFM segments unreliable until they establish a pattern.
Best practices to overcome these limitations include:
- Use quantile-based scoring rather than absolute thresholds so segments automatically adjust to your customer base distribution.
- Apply weighted metrics that reflect your business model, giving more importance to recency for fashion retailers or monetary value for B2B suppliers.
- Segment customers by tenure first, then apply RFM separately to new, established, and long-term customer groups.
- Account for seasonality by comparing customers to the same period in previous years rather than using rolling windows that mix seasonal effects.
- Automate weekly data refreshes so segments stay current as customer behavior evolves.
Over-segmentation creates too many groups to action effectively. Aim for 8 to 12 meaningful segments rather than analyzing all 125 possible RFM combinations individually. Collapse similar score combinations into broader behavioral groups that your marketing team can realistically target with distinct campaigns.
Validate your segments by checking whether they correlate with business outcomes. Calculate average customer lifetime value for each RFM segment and verify that Champions truly generate more revenue than Loyal customers. Track churn rates by segment to confirm At-Risk customers actually leave at higher rates. If your segments don’t show clear performance differences, revisit your scoring methodology or consider whether your analysis window is too short to capture meaningful patterns.
Monitor segment stability over time. If customers rapidly shift between segments week to week, your scoring may be too sensitive to normal purchase variation. Conversely, if segments remain static for months, you might need shorter analysis windows or more granular scoring. Finding the right balance ensures your segments reflect genuine behavioral changes worthy of marketing response while filtering out noise. Check your segmentation against retention strategies outlined in optimize ecommerce retention lasting growth to ensure alignment with proven retention frameworks.
Boost your analysis with Affinsy’s e-commerce analytics tools
Turning purchase pattern insights into revenue requires more than spreadsheets and manual calculations. Affinsy automates the entire analytical process, from data extraction through actionable recommendations, so you can focus on strategy rather than number crunching.

Our platform handles RFM segmentation, cohort tracking, and market basket analysis automatically, updating your customer segments as new transactions flow in. Predictive analytics models forecast which customers will churn, when they’re likely to purchase next, and what products they’ll want. This transforms reactive marketing into proactive engagement that reaches customers at precisely the right moment.
Affinsy’s customer segmentation tools go beyond basic RFM by incorporating product affinity, browsing behavior, and purchase timing into multi-dimensional profiles. You’ll discover micro-segments within your customer base that respond to different messaging, product recommendations, and promotional strategies. Integration with your existing marketing stack means insights flow directly into email campaigns, ad targeting, and personalization engines without manual exports.
Pro Tip: Connect Affinsy to your Shopify or WooCommerce store today and see your first customer segments within minutes. The platform’s visual dashboards make complex patterns immediately understandable, while automated reports keep your team aligned on which segments need attention and what actions will drive the biggest impact.
Frequently asked questions
What is the RFM method in customer purchase analysis?
RFM stands for Recency, Frequency, and Monetary value, three metrics that quantify customer buying behavior. The method scores each customer on how recently they purchased, how often they buy, and how much they spend, then combines these scores to create segments like Champions, Loyal, At-Risk, and Lost. This segmentation enables targeted marketing strategies tailored to each group’s behavior and value.
How do I handle new customers when analyzing purchase patterns?
New customers lack sufficient purchase history for reliable RFM scoring since they have minimal frequency data and limited monetary value. Segment new customers separately and focus on recency and engagement metrics like email opens or site visits until they complete 2 to 3 purchases. Once they establish a pattern, incorporate them into standard RFM analysis with your established customer base.
Can purchase pattern analysis predict future buying behavior?
RFM analysis alone describes past behavior but doesn’t predict future actions with high confidence. Combining RFM segments with machine learning models trained on historical patterns significantly improves prediction accuracy for metrics like churn probability, next purchase date, and lifetime value. The predictive power increases with larger datasets and more behavioral features beyond the three RFM metrics.
How often should I refresh my customer purchase data?
Weekly data refreshes strike the optimal balance between keeping segments current and avoiding excessive volatility from normal purchase variation. E-commerce businesses with daily transaction volumes benefit most from weekly updates since customer behavior can shift quickly, especially during promotional periods. Monthly refreshes work for businesses with longer purchase cycles, but weekly cadence ensures your marketing campaigns target the most accurate, up-to-date customer segments.
Recommended
- How to Analyze Sales Data for Smarter E-Commerce Growth - Affinsy Blog | Affinsy
- How to Analyze Ecommerce Sales Data for Better Growth - Affinsy Blog | Affinsy
- E-commerce Data Analysis Tutorial: Boost Sales with Insights - Affinsy Blog | Affinsy
- Market Basket Analysis Guide: Boost Your Sales Effectively - Affinsy Blog | Affinsy
- Streamline checkout for retail success in 2026 - Omnichannel payments at the Point Of Sale | Sensepass