
TL;DR:
- Most ecommerce marketers focus on revenue but often overlook customer behavior, leading to stagnant retention. The RFM model uses existing order data to score customers on recency, frequency, and monetary value, enabling targeted segmentation. Regularly updating scores and leveraging behavioral segments significantly improves campaign ROI and customer retention.
Most ecommerce marketers know their revenue numbers but not their customers. They send the same email to first-time buyers and loyal repeat customers, then wonder why retention rates stay flat. The RFM model ecommerce professionals need isn’t complicated. It uses three dimensions pulled directly from your order history: how recently someone bought, how often they buy, and how much they spend. No surveys, no demographics, no guesswork. Just behavioral data you already have, organized into a framework that tells you exactly who to target and how.
Table of Contents
- Key Takeaways
- The RFM model ecommerce fundamentals
- Scoring your customers with RFM
- Reading RFM segments and what they mean
- Putting RFM into your marketing workflow
- What I have learned from watching teams misuse RFM
- How Affinsy makes RFM segmentation fast
- FAQ
Key Takeaways
| Point | Details |
|---|---|
| RFM uses existing data | Score customers on Recency, Frequency, and Monetary value using order history you already own. |
| Quintile scoring is the standard | Divide customers into five equal groups per dimension to build consistent, comparable segments. |
| Frequency predicts churn early | Declining purchase frequency signals churn risk up to 6x before revenue drops show it. |
| Segments drive campaign ROI | RFM segmented emails generate 3-5x more revenue per send than unsegmented blasts. |
| Dynamic updates are non-negotiable | Refresh scores weekly or bi-weekly so your segments reflect actual customer behavior right now. |
The RFM model ecommerce fundamentals
RFM stands for Recency, Frequency, and Monetary value. Each dimension captures a different angle of customer behavior, and together they give you a complete picture of who your best customers actually are.
Recency measures how long ago a customer made their last purchase. A buyer who ordered three days ago is far more likely to convert on your next campaign than one who hasn’t ordered in 11 months. Recency is the strongest predictor of immediate purchase probability, which makes it your most time-sensitive metric.
Frequency tracks how many times a customer has purchased in your measurement window. This is where loyalty lives. Customers in the top frequency quintile show 3.2x higher lifetime value and 65% lower churn compared to low-frequency buyers. Frequency is also your best early-warning system: declining purchase patterns correlate with up to 6x increased churn risk before that churn ever shows up in your revenue data.
Monetary value captures total spend, typically lifetime spend rather than average order value. Why lifetime spend? Because monetary values follow a right-skewed distribution in most ecommerce stores. A handful of high-ticket buyers can distort your averages and mislead your segmentation if you’re not careful.
Here is what makes RFM genuinely different from demographic segmentation:
- It measures actual behavior, not assumed preferences
- It works with data every ecommerce platform already records
- It captures behavioral change over time, not just a static snapshot
- It treats a $200 frequent buyer differently from a $200 one-time buyer
Pro Tip: Don’t define “recent” by calendar logic alone. A brand selling coffee pods should define recent as 30 days. A brand selling mattresses should treat 180 days as recent. Your RFM thresholds should match your product’s natural repurchase cycle.
One trap marketers fall into is treating monetary value as the primary signal of customer quality. A customer who spent $800 once two years ago is not the same as one who has placed six orders totaling $400 this year. The second customer is the one you should be protecting.
Scoring your customers with RFM
The scoring method that has become the industry standard for RFM analysis for online stores divides each dimension into five equal groups called quintiles. Every customer gets a score from 1 to 5 on each dimension, where 5 always represents the most desirable behavior. That gives you a three-digit composite score like 5-5-5 for your best customers and 1-1-1 for those who are effectively lost.
The standard scoring thresholds for 2026 look like this for most ecommerce brands:
| Dimension | Score 5 | Score 4 | Score 3 | Score 2 | Score 1 |
|---|---|---|---|---|---|
| Recency | Last 30 days | 31 to 90 days | 91 to 180 days | 181 to 365 days | Over 365 days |
| Frequency | 10+ orders | 6 to 9 orders | 3 to 5 orders | 2 orders | 1 order |
| Monetary | Top 20% spend | 21 to 40% spend | 41 to 60% spend | 61 to 80% spend | Bottom 20% spend |
These thresholds are a strong starting point, but treat them as a baseline, not gospel. A business selling home gym equipment may see annual repurchases at best, so a customer who bought 90 days ago might genuinely deserve a Recency score of 5. An apparel brand running seasonal campaigns might see top buyers ordering six times per year rather than ten.
For Monetary scoring specifically, use total lifetime spend rather than average order value wherever possible. This prevents high single-ticket buyers from distorting the top tier, and it rewards the consistent, relationship-driven buying behavior that actually predicts long-term revenue.
Pro Tip: Automate your scoring updates on a fixed schedule. Automating RFM score refreshes integrated directly with your email and marketing platforms maximizes retention and campaign efficiency. A score that is two months stale is actively misleading your campaigns.
Once you have scores assigned, you do not need to market to 125 possible combinations of R, F, and M scores. Most brands operate effectively with six to ten named segments built from logical score clusters.
Reading RFM segments and what they mean
Your RFM scores become useful the moment you translate them into named segments with clear behavioral profiles. Here are the core segments most ecommerce brands work with:
| Segment | Typical RFM Scores | Behavioral Profile | Strategic Priority |
|---|---|---|---|
| Champions | 5-5-5, 5-4-5 | Bought recently, buy often, spend the most | Reward, upsell, ask for referrals |
| Loyal Customers | 4-4-4, 4-5-3 | Consistent purchasers, moderate recency | Loyalty programs, exclusive offers |
| Potential Loyalists | 5-2-3, 5-3-2 | Recent buyers with low frequency so far | Nurture with second-purchase incentives |
| At-Risk | 2-4-4, 2-5-3 | Used to buy often but recency is sliding | Win-back flows, personal outreach |
| Hibernating | 1-2-2, 1-3-2 | Haven’t bought in a year, low frequency | Low-cost re-engagement or sunset |
| Lost | 1-1-1, 1-1-2 | Maximum inactivity across all dimensions | Suppress or remove from active lists |
Champions and Loyal Customers typically represent 15 to 20 percent of your customer base but generate 60 to 70 percent of your revenue. That ratio tells you where protecting existing relationships matters more than acquiring new ones.

At-Risk customers are where RFM earns its keep. This group scored well on Frequency and Monetary in the past, but their Recency score is falling. Purchase behavior-based segmentation catches these customers far earlier than engagement metrics like email opens do. Someone can open every email you send for three months and still never buy again.
For Potential Loyalists, the goal is closing the second purchase as quickly as possible. A customer who buys twice is dramatically more likely to buy a third time than a customer who has only bought once. Target this segment with specific product recommendations based on what they bought first.
You can explore RFM segmentation for DTC brands in more depth, including how to build win-back flows specifically around score declines.
Putting RFM into your marketing workflow
Understanding RFM is one thing. Building it into a system that runs reliably is where most teams stall. Here is a practical sequence that works:
Step 1: Export your order data. Pull a clean transaction file that includes customer ID, order date, order value, and order count. Every major ecommerce platform exports this natively. If you are on WooCommerce, you can use a dedicated order exporter to get exactly the fields RFM scoring needs without manual cleanup.
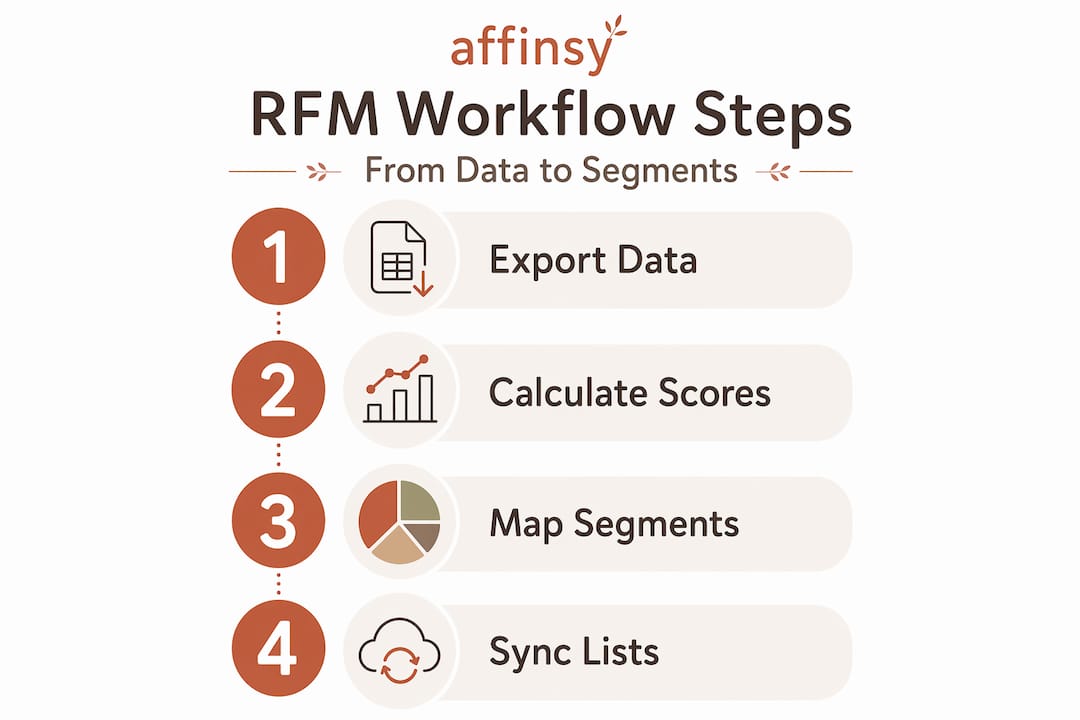
Step 2: Calculate scores. Use quintile division on your actual customer population, not on assumed thresholds. If 80 percent of your customers have only ordered once, your Frequency score of 2 might actually start at two orders, not six. Your population defines your quintiles.
Step 3: Map scores to segments. Assign each customer to a named segment based on their composite score. Keep your segment definitions documented so everyone on the team is working from the same definition.
Step 4: Sync segments to your email service provider. Most modern ESPs support dynamic lists or tags. The goal is for a customer who moves from At-Risk to Lost to automatically drop out of your win-back flow and stop receiving messages that no longer make sense for them.
Step 5: Set your refresh cadence. Weekly or bi-weekly RFM score updates are the standard for ecommerce brands with regular purchase cycles. High-frequency categories like consumables may benefit from daily refreshes.
A few things to get right from the start:
- Exclude very recent buyers from win-back and re-engagement flows. Someone who bought four days ago does not need a “we miss you” email.
- Track segment migration, not just campaign performance. A customer moving from At-Risk to Loyal is a win even if they did not click on anything.
- Measure lifetime value changes by segment over 90-day rolling windows to see whether your campaigns are actually moving the needle.
Segment-specific campaigns built around RFM profiles achieve 3 to 5x higher ROI than undifferentiated sends. That is not a marginal improvement. That is the difference between a marketing budget that compounds and one that bleeds out slowly.
Pro Tip: Do not make your RFM implementation more elaborate than your team can maintain. Six well-defined segments you actually act on beat twenty segments nobody has time to manage. Start narrow, prove the model, then expand.
What I have learned from watching teams misuse RFM
I have seen more teams build an RFM model once, celebrate it for a week, and then let it go stale for six months than I would like to admit. That is the most common failure mode and it is entirely avoidable.
The second mistake I see constantly is over-indexing on Monetary value. A high spender who bought once 14 months ago is often treated like a champion customer when they are actually a lapsed buyer at serious churn risk. Marketers should prioritize frequency and recency over monetary value to identify genuinely loyal customers and avoid misclassifying single large-ticket buyers as your best segment.
In my experience, frequency is the metric that tells you the most honest story about a customer’s relationship with your brand. When I see a customer’s purchase frequency start to slow without any obvious seasonal reason, that is an early warning worth acting on immediately. Not in three months when the revenue impact shows up. Right now, when there is still something you can do about it.
The part that most articles skip is this: RFM is not a segmentation tool. It is a behavioral early-warning system. The true power of RFM lies in proactive management, catching churn before it happens rather than reacting after revenue has already walked out the door. The brands that treat RFM scores as living signals rather than static labels are the ones that actually retain customers at scale.
You can get deeper on the behavioral layer by looking at how purchase pattern analysis connects to segment movement over time.
— Mateusz
How Affinsy makes RFM segmentation fast

Running RFM segmentation manually is possible, but it gets tedious fast once your customer base grows past a few thousand. Affinsy is built specifically to handle this at scale without requiring a data science team. You export your order history from Shopify, WooCommerce, BigCommerce, or any platform that produces transaction data, and feed it into Affinsy via CSV upload or API. The platform calculates RFM scores, surfaces your customer segmentation groups automatically, and shows you exactly which customers are sliding toward churn before it costs you revenue.
Affinsy’s permanent free tier supports up to 20K line items with full product access and no credit card required. If you are on WooCommerce and want a clean export to feed into your analysis, the free WooCommerce order exporter gets your data into exactly the right format. No manual formatting, no spreadsheet gymnastics. Just your data, ready to score.
FAQ
What does RFM stand for in ecommerce?
RFM stands for Recency, Frequency, and Monetary value. These three dimensions of customer purchase behavior are used together to score and segment customers based on their actual buying patterns.
How do you score customers using the RFM model?
Customers are divided into five equal groups (quintiles) on each dimension and assigned scores from 1 to 5, where 5 is the most desirable behavior. Standard recency thresholds run at 30, 90, 180, and 365 days.
How often should RFM scores be updated?
Weekly or bi-weekly updates are standard for most ecommerce brands. High-frequency categories like consumables may need daily refreshes to catch behavioral shifts early enough for proactive outreach.
Which RFM dimension is most important?
Recency is the strongest predictor of immediate purchase probability, while frequency is the best predictor of long-term churn risk. Monetary value alone can be misleading due to outliers and should always be combined with the other two dimensions.
Can you run RFM analysis without technical skills?
Yes. Tools that accept CSV uploads of your order history do the scoring automatically. The main requirement is a clean transaction file with customer ID, order date, and order value. No coding or data science background is needed.
Recommended
- Master RFM Analysis to Boost E-Commerce Sales - Affinsy Blog | Affinsy
- RFM Segmentation for DTC Brands: How to Turn Shopify Customer Data Into a Retention Playbook - Affinsy Blog | Affinsy
- How to analyze customer purchase patterns to boost sales - Affinsy Blog | Affinsy
- Customer segmentation workflows that drive e-commerce growth - Affinsy Blog | Affinsy