This article walks through a concrete market basket analysis example, using an illustrative accessories catalog with 1,000 completed orders, to show how association rules turn raw transaction data into cross selling opportunities and average order value gains. Every figure in the worked example is internally consistent, so you can check each calculation as you read. The audience is CRO and retention agencies managing multiple e-commerce client accounts, where the deliverable is a campaign or merchandising change, not a dashboard. By the end you will know how to perform market basket analysis on an order export, read support, confidence and lift correctly, spot cannibalization before it costs money, and turn the output into a sized customer list.
What is market basket analysis?
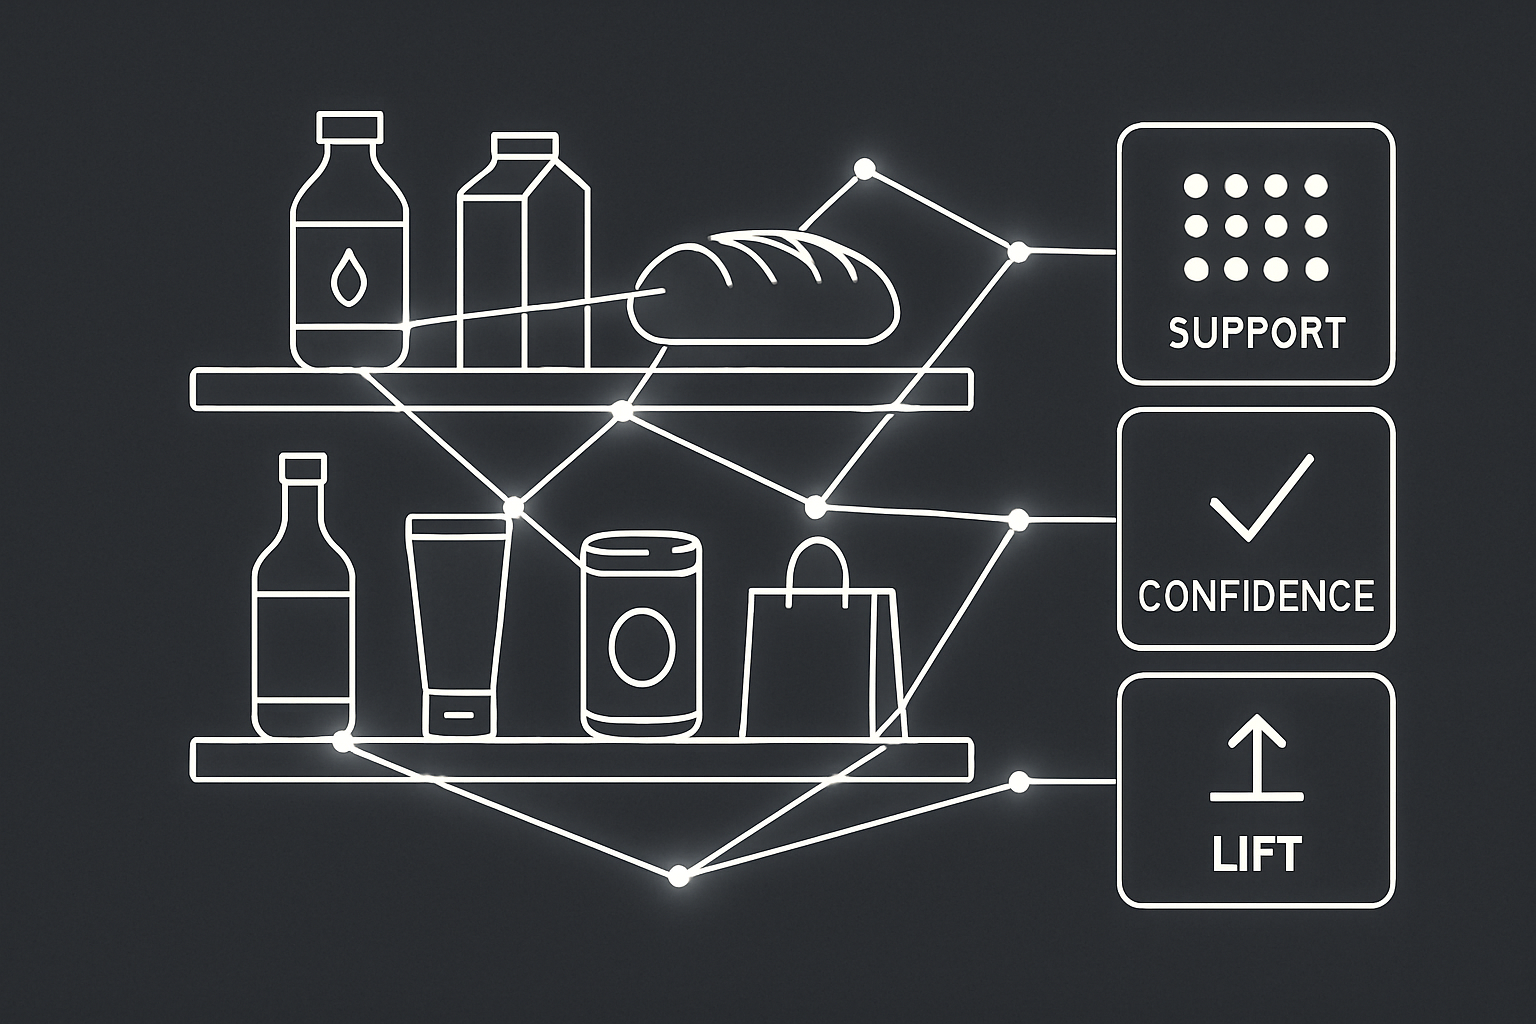
Market basket analysis is a data mining technique used to find product associations in historical order data. It uses association rule learning to study purchasing habits: which items purchased together in the same transaction appear more often than chance would predict. A market basket is one completed order. The technique scans the entire dataset of baskets, identifies combinations of products that frequently occur together, and quantifies the strength of each pairing.
The output is a set of association rules. Each rule describes a relationship in IF/THEN form: if a customer buys a phone case, they are 2.4 times more likely to buy a screen protector than a random customer. Market basket analysis uncovers purchase patterns in retail transactions, and it identifies products frequently bought together to enhance sales.
Applications are broad. In a retail setting, supermarkets create meal deal bundles based on market basket analysis rules, and the classic teaching example is that customers who buy bread also tend to buy milk. Amazon's "frequently bought together" module is the best known consumer-facing version of the same idea. Fashion retailers suggest outfit combinations using the same data. Beyond retail, common applications of market basket analysis span e-commerce, banking (where banks use it to identify cross selling opportunities for financial products), healthcare (where it can optimize medication stock and patient treatment plans), telecommunications, and even fraud detection. Market basket analysis also informs product placement and promotions, and it refines store layouts for better customer engagement.
There are three broad flavors. Descriptive market basket analysis looks at what already happened in the order history. Predictive market basket analysis tries to forecast future baskets from past behavior, functioning as a form of predictive analysis. Differential market basket analysis compares baskets across groups or time periods to spot shifts. This article focuses on the descriptive type, because that is what produces the rules an agency can act on immediately.
Association rules, explained in plain language
An association rule has two sides. The antecedent is what is already in the basket; the consequent is what becomes the cross-sell target. In merchant language: the antecedent is the product the customer already chose, and the consequent is the one you want them to add.
Association rule mining scans all orders to generate association rules and quantify how strong each IF/THEN relationship is. Phone Case to Screen Protector. Coffee beans to grinder. Strong rules become cross-sell blocks on product pages, email triggers after purchase, or bundle offers at checkout. Weak rules get ignored because they lack the statistical weight to justify a test.
Key metrics in market basket analysis: support, confidence, lift
Three key metrics score every association rule: support, confidence, and lift. These are the backbone of association rule mining regardless of which machine learning algorithms produced the rules. Agencies use them to decide which product combinations deserve a test in a client's merchandising or email program.
Support: how common the pair is across all orders
Support measures how often items appear together in transactions. It is the share of all completed orders containing both products. Support is calculated as the frequency of itemsets divided by total transactions.
In the illustrative catalog: 96 of the 1,000 orders contain both Phone Case and Screen Protector, so the corresponding support is 96 / 1,000 = 9.6%.
Agencies set a minimum support threshold to filter out pairs too rare to move revenue. What counts as "too rare" depends on order volume. A pair appearing in 20 of 1,000 orders may be worth reading; the same 20 out of 200,000 is noise. Support connects directly to commercial impact: higher support means more customer transactions will be affected by any merchandising change.
Confidence: how often the rule holds when A is bought
Confidence indicates the likelihood of purchasing item B given item A. It is calculated as combined transactions divided by individual transactions of the antecedent.
In the example: 96 of the 220 Phone Case orders also contain a Screen Protector, so confidence for Case to Protector is 96 / 220 = 43.6%. That means when a customer buys a case, there is a 43.6% chance they also bought a protector.
Reversing direction changes confidence but not lift. Of the 180 Protector orders, 96 also contain a Case, giving confidence of 96 / 180 = 53.3%. That asymmetry is practical: the protector buyer is the better person to show a case prompt to, because the attachment rate in that direction is higher.
Lift: separating genuine attraction from coincidence
Lift compares actual co-occurrence against expected independence. A lift value above 1 indicates a positive association between items. Lift measures the strength of association between itemsets, and a lift greater than 1 indicates a strong association between products.
For Case to Protector: confidence is 43.6%, and Screen Protectors appear in 18% of all orders. Lift is 43.6% / 18% = 2.42. Case buyers are 2.42 times more likely to add a protector than if the two products were chosen independently. Lift is symmetric: it is 2.42 whether you read the rule as Case to Protector or Protector to Case.
Lift of 1.0 means no relationship. Above 1.0 means attraction, a complement pair. Below 1.0 means the products repel each other, which signals substitutes and cannibalization risk.
Why confidence alone will mislead you

This is where most first attempts at market basket analysis go wrong. The Charging Cable appears in 600 of 1,000 orders, a 60% share. Of the 220 Case orders, 140 also contain a Cable. Confidence for Case to Cable is 140 / 220 = 63.6%, which looks stronger than the 43.6% for Case to Protector.
But lift tells a different story. Lift for Case to Cable is 63.6% / 60% = 1.06, barely above chance. The Cable would produce high confidence values against almost any product because it is in most baskets. It is among the most frequently purchased items in the catalog, not a genuine companion to the Case.
The Protector rule has lower confidence (43.6%) and higher lift (2.42). That is the pair worth testing.
Rank by lift, not confidence. Confidence rewards popularity; lift rewards relationship. Agencies that sort by confidence first end up recommending items customers tend to buy anyway, which produces cross-sell widgets that look busy but do not grow the order.
Worked market basket analysis example: an illustrative 1,000-order accessories catalog
The numbers that follow are illustrative, not drawn from a real store or client. They exist so every calculation in this article is checkable.
The catalog has five products across 1,000 completed orders:
| Product | Orders containing it | Share of all orders |
|---|---|---|
| Phone Case | 220 | 22.0% |
| Screen Protector | 180 | 18.0% |
| Wireless Charger A | 140 | 14.0% |
| Wireless Charger B | 120 | 12.0% |
| Charging Cable | 600 | 60.0% |
Co-occurrence counts for the pairs we will examine: Case and Protector together in 96 orders, Case and Cable together in 140 orders, Charger A and Charger B together in 4 orders. Every derived value below comes from these counts.
Step 1: get the orders into basket shape
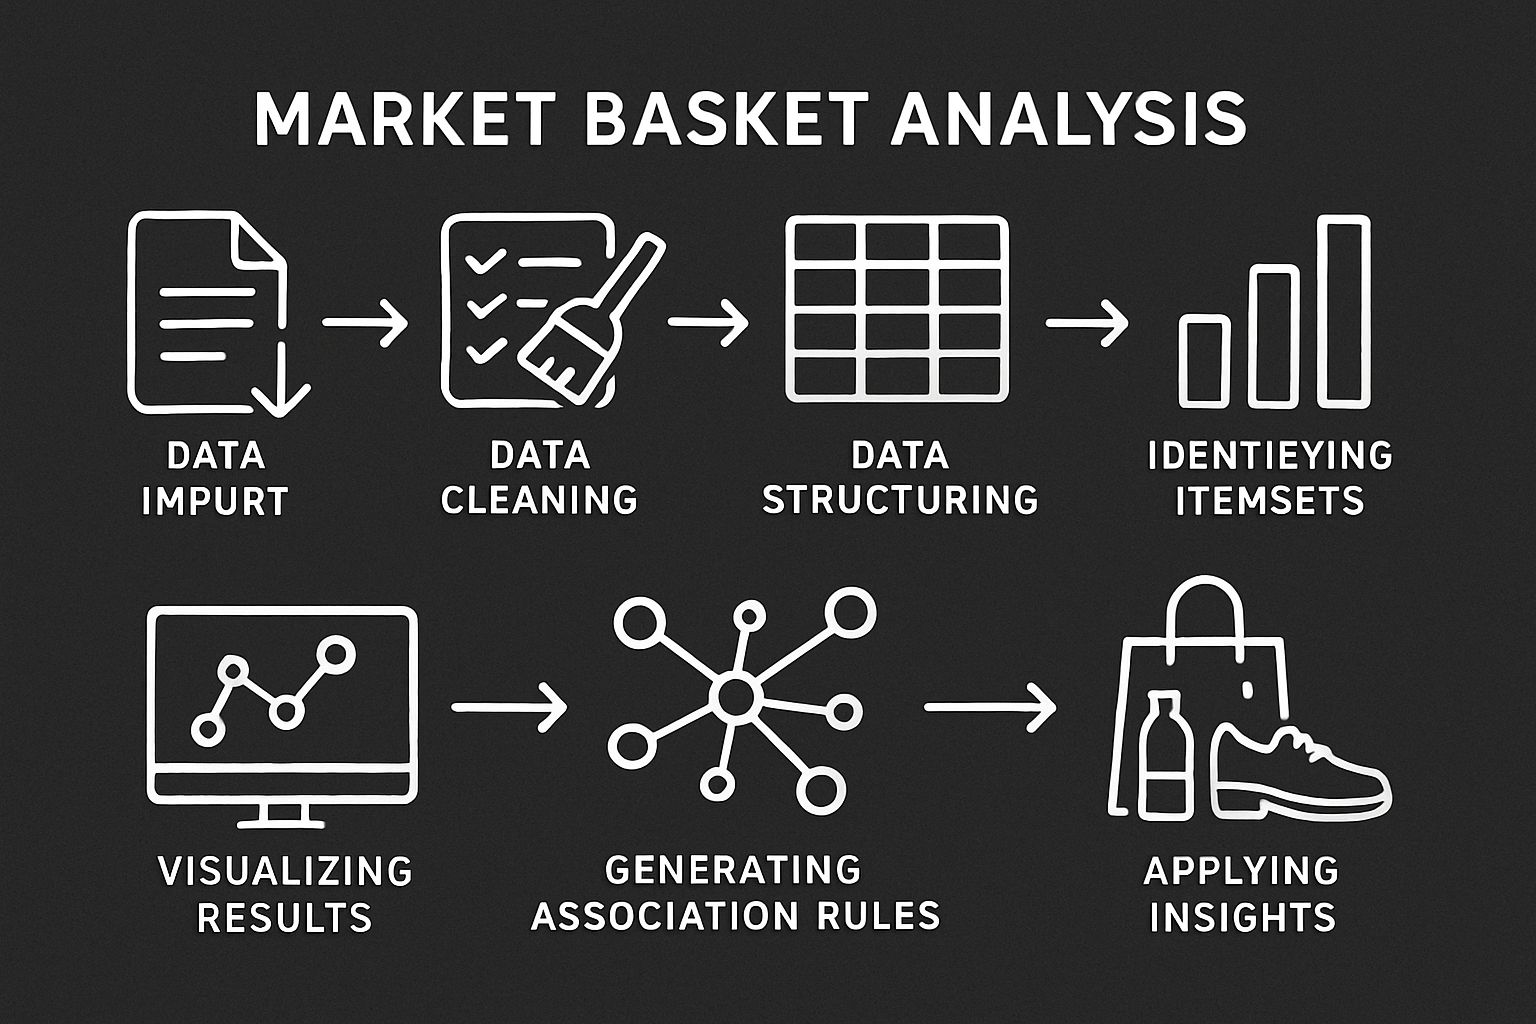
Most order exports arrive as line items: one row per product per order. To perform market basket analysis, you need to reshape the transactional data so each order is one row listing every product bought in that same trip. A basket of {Case, Protector, Cable} that exported as three line-item rows becomes a single row with three items.
Minimum fields: order ID, product identifier or SKU, quantity, and order timestamp. A customer identifier is optional for basket-level work, but it is what makes customer-level analysis and audience building possible later. Without it you can find which items occur together but cannot build a list of the same customer to target.
Before counting anything, remove test orders, refunded orders, and internal purchases. A handful of test baskets containing products that never ship to real customers will inflate support for pairs that do not exist in real customer behavior.
Step 2: count pairs and compute support, confidence, lift
Start by counting how many orders contain each pair. From the illustrative data set: 96 orders contain both Case and Protector. 140 contain both Case and Cable. 4 contain both Wireless Charger A and Wireless Charger B.
Turn counts into support by dividing by the total 1,000 orders. Support for Case and Protector is 9.6%. Support for Case and Cable is 14.0%. Support for Charger A and Charger B is 0.4%.
Then compute directional confidence. Case to Protector: 96 / 220 = 43.6%. Protector to Case: 96 / 180 = 53.3%. Case to Cable: 140 / 220 = 63.6%.
Finally, lift. Case and Protector: 43.6% / 18.0% = 2.42. Case and Cable: 63.6% / 60.0% = 1.06. Charger A and Charger B: we will compute below in the cannibalization step.
| Rule | Support | Confidence | Lift |
|---|---|---|---|
| Case to Protector | 9.6% | 43.6% | 2.42 |
| Protector to Case | 9.6% | 53.3% | 2.42 |
| Case to Cable | 14.0% | 63.6% | 1.06 |
The third row has the highest confidence and the lowest value. Market basket analysis answers the question of which pairs are worth acting on, and the answer comes from lift, not from raw co-occurrence.
Step 3: check for cannibalization before you bundle
This step gets skipped constantly, and it is the one that costs money.
Charger A appears in 140 orders, Charger B in 120. If the two were unrelated, the expected co-occurrence would be (140 / 1,000) x (120 / 1,000) x 1,000 = roughly 17 orders. The actual count is 4. Lift is 0.4% / (14.0% x 12.0%) = 0.24, well below 1.0.
These are substitutes. Customers pick one or the other, rarely both on the same trip. Bundling them would not lift average order value. It would move buyers from whichever charger they were going to choose to whichever the promotion favors. If the promoted unit carries lower margin, the top line looks flat while margin falls.
Identifying substitute pairs deliberately is valuable for two reasons. First, you avoid bundling items that cannibalize each other and identify items that actually boost sales. Second, you know the real alternative when one product goes out of stock, which is useful for inventory management and reducing stockouts. Market basket analysis can reveal hidden customer purchasing behaviors and product relationships, including these repulsion patterns that a confidence-only view would never surface.
Step 4: interpret the rules and turn them into action
A rule is not an outcome. A rule describes what customers already did unprompted. The value comes from what you do with it.
From the Case to Protector rule (lift 2.42, support 9.6%), three concrete moves follow:
-
Checkout prompt. Show a protector offer to every customer who adds a case. The 43.6% confidence tells you nearly half of case buyers already add a protector without prompting, so a prompt has a realistic floor.
-
Bundle price. Create a case-plus-protector bundle priced below buying separately. The support (9.6%) tells you approximately how many orders the bundle could affect. Our guide to increasing average order value with basket analysis covers how to size that revenue impact.
-
Post-purchase campaign. Of the 220 case buyers, 96 already bought a protector. That leaves roughly 124 who did not. Those 124 customer records become a sized, exportable list for an email campaign, which is the difference between a report and a deliverable.
Test every intervention against a holdout group. The rule is strong evidence a prompt will work, not proof. Measuring the incremental effect on attachment rate and average order value based on a controlled test is how you show the client what the analysis actually earned.
Algorithms used in market basket analysis: Apriori and FP Growth
Two algorithms handle most of the work to identify items that frequently occur together and generate possible rules from transactional data.
The apriori algorithm identifies frequent itemsets in transactions by scanning the database multiple times. It starts with individual products, then pairs, then triples, pruning any combination whose support falls below a minimum support and minimum confidence threshold at each pass. Candidate generation is explicit: every potential combination gets tested. That repeated scanning slows down performance on large catalogs, but for a store with a few hundred SKUs and a few thousand orders, Apriori runs in seconds.
The FP Growth algorithm builds a compressed tree structure for pattern mining, called an FP tree, that holds the entire data set in memory. It mines frequent itemsets from the tree without generating every candidate explicitly. For large catalogs or dense item combinations, fp growth is faster and uses less memory than Apriori. Eclat is a third option that intersects vertical item lists, but Apriori and FP Growth cover the vast majority of e-commerce use cases. This market basket analysis tutorial covers both in more formal detail.
For agencies, the algorithm is an implementation detail. The real task is setting sensible thresholds (minimum support, minimum confidence, minimum lift) and reading the output correctly. Once that is comfortable, advanced market basket analysis strategies covers what to do with the rules that survive.
Preparing your own order data
A few thousand orders is a reasonable floor for stable rule generation. Below that, pairs shift between runs and you cannot trust that a rule will hold next month.
Sources include platform exports from Shopify or WooCommerce, CSV files from your own database, or point-of-sale records from a physical retail setting. Basket-level analysis needs no personal customer data at all; order ID and product identifier per line item are enough to start.
Four things break the analysis:
-
Inconsistent product naming. The same item with three spellings becomes three products, splitting support across entries.
-
Variants treated as separate products. If every color of the same case is a distinct SKU, every purchasing pattern gets divided. Customer purchasing patterns span variants; your data should too.
-
Refunds and test orders left in. These inflate support for pairs that do not reflect real customer behavior. Handle missing values and null value entries in quantity or product fields before running anything.
-
Bundles sold as a single SKU. If a case-and-protector pack is one line item, the analysis cannot see the pairwise relationship you are looking for.
How often to re-run it, and what makes rules go stale
Rules go stale when the thing underneath them changes. The triggers are events, not calendar dates: the catalog shifted, a season turned, order volume doubled, or a promotion ran.
Promotions are the most common way a rule set gets quietly corrupted. Anything heavily bundled or discounted shows inflated co-occurrence in the data afterwards. You created that pairing rather than discovering it. If you then build a cross-sell recommendation on the inflated rule, you are reinforcing a temporary behavior as if it were organic.
Absent those triggers, quarterly re-runs are a reasonable default for most e-commerce accounts.
Two other pitfalls worth naming. First, naive mining generates hundreds of trivial rules (every product paired with the Charging Cable, for instance) that overwhelm a team needing a short prioritized list. Setting higher minimum support thresholds and filtering for lift above 1.5 or 2.0 cuts the noise. Second, smaller or newer brands have sparse data, so rules are unstable across multiple visits to the analysis. For those clients, wait until order volume grows before committing to merchandising changes based on a single run.
From analysis to action: average order value and retention
The point of market basket analysis is revenue, not rules. Market basket analysis increases average order value when the rules become interventions. Cross-selling strategies based on market basket analysis improve sales when they are tested and measured, not just deployed.
Tactics that map directly to association rules:
-
PDP recommendations. Show associated products on the product page for every antecedent item. The rule's lift tells you which recommendations are genuine and which are noise.
-
In-cart add-ons. Prompt the consequent product when the antecedent enters the cart. Measure attachment rate and lift average order value against a holdout.
-
Post-purchase flows. Email the consequent product to buyers who purchased the antecedent but not the complement, using the sized customer list from Step 4.
-
Replenishment reminders. For consumable or repeat-purchased items, basket analysis across multiple visits by the same customer reveals when the same item gets reordered. That cadence becomes a timed email trigger.
Market basket analysis insights also include optimizing inventory planning based on purchasing patterns, ensuring that frequently purchased items and their complements stay in stock together. The agency deliverable is the campaign or onsite change that moves a KPI, not a deck of rules. For applications that reach past merchandising, market basket analysis beyond the cart goes further.
Running market basket analysis across many client stores
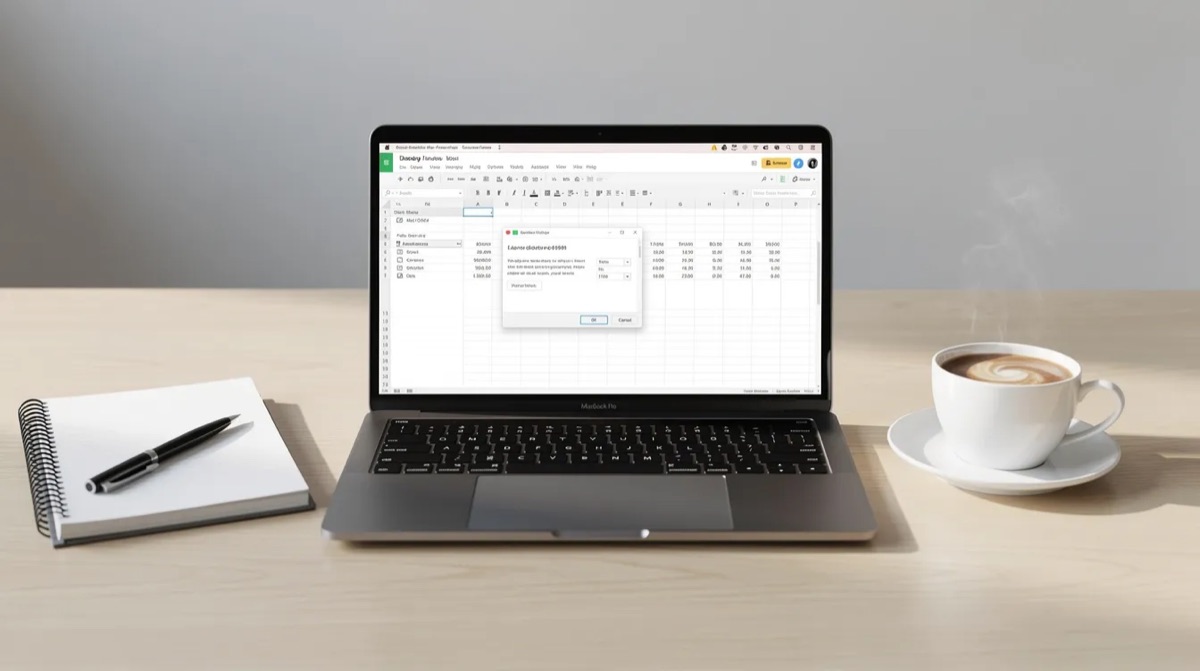
The manual workflow to implement market basket analysis for one client looks like this: export orders, clean the data, run the mining, review the rules, discard trivial ones, check for substitutes, and translate what survives into cross-sell tests. That is most of a working day.
At ten to twenty brands the math breaks. The analysis that justifies a hire at one store goes undone across the whole book of business. In practice, many agencies run basket analysis once at onboarding, then leave it untouched for a year. By the time anyone revisits, the catalog has changed, pricing strategies shifted, and customer behavior drifted. The original rules describe a store that no longer exists.
The way out is making the analysis repeatable rather than heroic: a fixed data shape every time, the same thresholds every run, substitute detection checked automatically, and output landing as a ranked customer list rather than a slide. That turns market basket analysis work from a quarterly project into a recurring part of the client's testing roadmap.
Where Affinsy fits for agencies doing market basket analysis
Affinsy is built for CRO and retention agencies that need market basket analysis and RFM customer segmentation across many e-commerce clients from a single workspace.
Data comes in by CSV upload, webhook, or API, alongside direct connections to Shopify, WooCommerce, Shoper, and Google Analytics. Each client store is handled as a separate data set inside one workspace.
Outputs from Affinsy's market basket analysis reports include:
-
Product pairs with support, confidence, and lift.
-
Substitute pairs where lift falls below 1.0, flagging cannibalization risk before you bundle.
-
Sequential patterns across orders for the same customer, showing which products follow which over time.
-
Replenishment cadence for repeat purchases of the same item, giving you the timing for reorder campaigns.
Each rule carries an RFM segment mix showing which segments (Champions, At-Risk, Hibernating) drive it. Any rule can become a ranked, exportable customer list sized for a specific campaign, turning a statistical finding into a deliverable.
Pricing is one Agency plan at $299 per month with a 7-day trial, flat regardless of how many client stores are connected. Affinsy is not a white-label product or a marketplace app.
Next steps: extending basket analysis to segments and timing
Once a team is comfortable reading lift and using association rules to identify cross selling opportunities, the next layer is which RFM segments drive each rule. A Case to Protector rule with lift 2.42 overall may look different when split by segment: first-time buyers may show a 3.0 lift while loyal repeat customers show 1.4, because repeat customers already own both. That distinction changes where you invest the campaign budget.
Sequential patterns and replenishment cadence move an agency from one-off cross-sell suggestions to full lifecycle programs. Instead of guessing when to send a reorder email, you time it from the actual interval between repeat purchases by the same customer across multiple visits. Market basket analysis for ecommerce growth picks up from there.
Treat market basket analysis as a recurring input to the client's testing roadmap, not a one-time project. Each rule becomes a hypothesis. Each hypothesis becomes a test. Each test produces a measurable result you can show the client.
The single most useful habit: read lift before confidence. Confidence rewards popularity; lift rewards relationship. The difference between those two numbers is the difference between a bundle that grows the order and one that just rearranges it.