
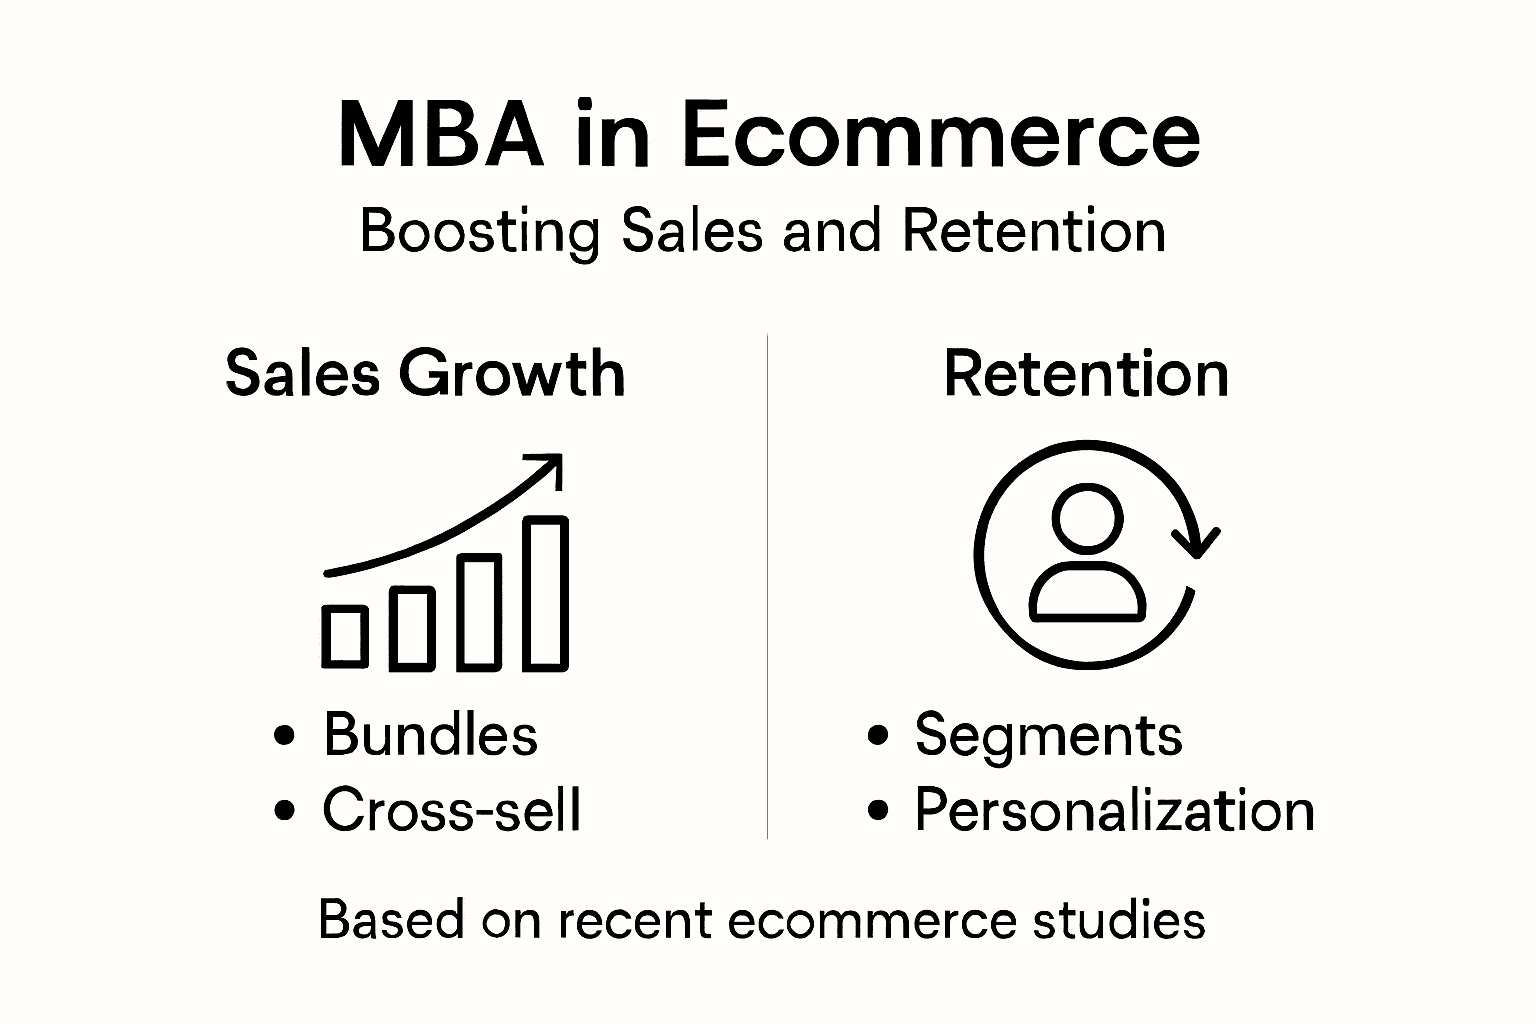
Finding the right product pairings in your store can feel like searching for hidden treasure. For E-commerce owners and marketing managers, market basket analysis makes this search smarter by revealing the combinations that drive sales and loyalty. By uncovering which items your customers purchase together, you can craft bundles that make sense, launch cross-sell offers that work, and design retention strategies powered by real data instead of guesswork.
Table of Contents
- Market Basket Analysis In E-Commerce Defined
- Types And Methods Of Market Basket Analysis
- How MBA Powers Product Bundling And Cross-Selling
- MBA-Driven Customer Segmentation For Retention
- Common Challenges And Mistakes To Avoid With MBA
Key Takeaways
| Point | Details |
|---|---|
| Market Basket Analysis (MBA) Enhances Sales Strategy | MBA reveals purchasing patterns, allowing e-commerce owners to optimize product placement, bundling, and cross-selling to increase average order value and customer satisfaction. |
| Data Quality is Crucial | High-quality, clean data is essential for accurate MBA results; poor data leads to misleading insights and ineffective strategies. |
| Actionable Insights from Segmentation | Combining MBA with customer segmentation enables personalized marketing, enhancing retention by tailoring communication to specific buying behaviors. |
| Testing and Validation of Strategies | It is vital to test and validate MBA insights with real customer data before full implementation to avoid costly mistakes from unproven actions. |
Market basket analysis in e-commerce defined
Market basket analysis (MBA) is the process of examining what customers buy together to uncover hidden purchasing patterns. Think of it like standing in a grocery store and noticing that people who buy diapers often grab baby wipes at the same time. Your e-commerce store has thousands of these patterns hiding in transaction data, waiting to be discovered.
What makes MBA valuable for e-commerce owners? It reveals which products naturally belong together in customers’ minds. When you understand collections of items customers frequently purchase together, you can make smarter decisions about product placement, bundling, and recommendations. This directly impacts your bottom line.
Here’s what MBA actually analyzes in your store:
- Product relationships: Which items appear in the same transaction
- Purchase frequency: How often specific product combinations occur
- Customer buying behavior: Patterns that reveal what matters to your shoppers
- Cross-selling opportunities: Products you can promote together to increase order value
Why should you care? Identifying patterns in product purchases lets you optimize inventory management, improve customer satisfaction, and increase average order value simultaneously. You’re not guessing anymore—you’re using actual data from your own customers.
The practical applications directly impact your sales strategy. Bundling related products increases perceived value. Smarter recommendations reduce decision fatigue. Better inventory placement keeps customers engaged longer on your site.
How MBA Works in Your Store
Market basket analysis doesn’t require complex algorithms that you can’t understand. It simply looks at your transaction history and asks: “What items tend to appear together?”
For example, if 40% of customers who buy running shoes also purchase moisture-wicking socks within the same month, that’s a signal. You can bundle these, place them near each other, or recommend one when customers view the other.
The process involves three core steps:
- Collect transaction data from your sales history
- Analyze which products appear together across multiple purchases
- Calculate metrics that show the strength of these relationships
These insights then feed into your customer retention strategy by enabling personalized marketing based on actual buying patterns rather than assumptions.
Market basket analysis transforms raw transaction data into actionable product strategies that drive both sales growth and customer loyalty.
Many e-commerce owners think they need a data science degree to use this approach. You don’t. The insights emerge naturally when you examine your data systematically. Tools can automate this analysis, but understanding what you’re looking for matters more than the complexity of how you find it.
The difference between average e-commerce stores and thriving ones often comes down to this: Do you know what your customers actually want to buy together, or are you making assumptions?
Pro tip: Start by examining your top 20% of products—the bestsellers that drive most revenue. These typically have the strongest purchase associations and reveal the highest-impact bundling opportunities for your store.
Types and methods of market basket analysis
Market basket analysis isn’t one-size-fits-all. Different approaches work better depending on your data size, product catalog complexity, and how quickly you need results. Understanding which method suits your e-commerce store matters because the wrong choice wastes time analyzing irrelevant patterns.
There are two main categories of methods: algorithmic approaches and statistical refinements. Algorithmic methods find patterns, while statistical methods validate whether those patterns actually matter for your business.
Algorithmic Approaches
The most common algorithms in e-commerce are Apriori and FP-Growth. These aren’t fancy—they’re proven tools that have worked for decades.
Apriori algorithm examines your transaction data systematically. It starts by finding individual products that appear frequently, then builds combinations from there. If a product appears in 30% of transactions, Apriori notes it. Then it asks: which products appear together in those 30%? It’s methodical and thorough, but can slow down with massive catalogs.
FP-Growth takes a different approach. Instead of checking every possible combination, it builds a compact tree structure of your transaction patterns. This makes it faster than Apriori, especially when you have thousands of products. Many e-commerce platforms prefer FP-Growth because it handles real-world data volumes without grinding to a halt.
The choice between them depends on dataset size:
Here’s a quick comparison of the main algorithms used in market basket analysis:
| Algorithm | Best For | Processing Speed | Catalog Size Suitability |
|---|---|---|---|
| Apriori | Small to medium catalogs | Slower with large sets | Under 500 products |
| FP-Growth | Large catalogs | Fast and scalable | 1,000+ products |
| Hybrid | Mixed data and needs | Balanced performance | Both small and large catalogs |
- Apriori: Better for smaller catalogs (under 500 products) or exploratory analysis
- FP-Growth: Better for large catalogs (1000+ products) or real-time processing
- Hybrid approaches: Some platforms use both for different analysis depths
Statistical Enhancement Methods
Finding patterns isn’t enough. You need to know if those patterns are statistically significant or just random coincidence. Association rule mining enhanced with statistical tests validates whether two products truly belong together.
Statistical methods filter out weak associations. Imagine your analysis shows that customers who buy Product A also buy Product B. But what if that’s just because both are bestsellers everyone buys anyway? Statistical tests reveal the actual relationship strength, not just coincidence.
Choosing Your Approach
Algorithms like Apriori and FP-Growth identify frequent itemsets by scanning your transaction history. The efficiency varies based on your data structure and how you implement them.
For most e-commerce store owners, the real decision is simpler than it sounds. You need speed, accuracy, and actionable results. Modern platforms handle the algorithmic complexity automatically. Your job is understanding what the results mean and how to act on them.
Choose an approach based on your catalog size and analysis frequency, not on which algorithm sounds most sophisticated.
Consider these practical factors when selecting a method:
- Data volume: More transactions require faster algorithms
- Product count: Larger catalogs benefit from efficient pattern detection
- Update frequency: Real-time recommendations need faster processing
- Statistical rigor: Premium insights warrant statistical validation
Many successful e-commerce stores start simple—using Apriori to understand basic patterns. As they grow and need faster analysis, they migrate to FP-Growth or hybrid approaches. This progression makes sense because you learn the patterns that matter before optimizing for speed.
Pro tip: Start with whichever method your analytics platform supports natively—whether that’s Apriori or FP-Growth. The real value comes from acting on the insights, not obsessing over algorithmic purity.
How MBA powers product bundling and cross-selling
Market basket analysis transforms your transaction data into a revenue-generating machine. It reveals which products customers naturally want together, then lets you capitalize on those patterns through strategic bundling and intelligent recommendations.

The connection is direct: when you understand what sells together, you can package those items strategically and recommend them at exactly the right moment. This isn’t guesswork anymore—it’s data-driven sales acceleration.
Powering Product Bundling
Bundling means selling complementary products as a package deal. MBA shows you which combinations make sense to bundle. Your data reveals the strongest natural pairings, not your intuition.
MBA uncovers patterns of product co-purchases that let you create bundles customers actually want. If your analytics show that 65% of people buying running shoes also buy moisture-wicking socks, you have a bundle winner.
Effective bundles increase perceived value. A customer sees three items separately priced at $15, $12, and $18. But bundled together at $38, it feels like they’re saving money even though you captured the same revenue. The psychological win drives conversion.
Bundling also solves inventory challenges. If a product isn’t selling solo, bundling it with a bestseller moves both items. MBA identifies slow movers that pair well with fast movers, turning dead inventory into bundle revenue.
Powering Cross-Selling Strategy
Cross-selling means recommending related products when customers are already buying. MBA tells you exactly which recommendations work because they’re based on actual purchasing behavior, not category assumptions.
Market basket analysis identifies sets of products frequently appearing together in transactions. When a customer adds Product A to their cart, your system instantly knows which products have the highest likelihood of acceptance.
Timing matters here. A customer buying winter jackets sees a recommendation for thermal underwear right then—not three days later in an email. Real-time, relevant recommendations drive impulse purchases that feel natural rather than pushy.
Cross-sell recommendations increase average order value without adding inventory cost. You’re simply showing customers what they already want to buy.
The Impact on Your Metrics
Consider the numbers. Say your average order value is $65 and your bundling and cross-selling strategy increases that by 18% through MBA insights:
- New average order value: $76.70
- Monthly revenue boost (100 orders/month): $1,170 additional revenue
- Annual impact: $14,040 from one simple optimization
These aren’t theoretical numbers—they come from stores implementing data-driven bundling and cross-sell strategies.
Market basket analysis turns transaction data into specific product combinations that naturally drive higher spending.
Key actions MBA enables:
- Identify high-probability pairs and bundle them
- Time recommendations when customers are most receptive
- Test bundle pricing against individual product prices
- Adjust dynamically as seasons and trends shift
The stores winning at this understand that bundling and cross-selling aren’t aggressive sales tactics—they’re customer service. You’re showing people what they want to buy anyway.
Pro tip: Start bundling only your top 3-5 product combinations identified by MBA. Test these aggressively before expanding to 20 bundles. Quality over quantity drives better margins.
MBA-driven customer segmentation for retention
Most e-commerce stores treat all customers the same. You send the same email to everyone, show the same homepage to everyone, and make the same offers to everyone. Then you wonder why retention suffers.
Market basket analysis changes this by revealing how different customer groups actually behave. When you combine MBA with segmentation, you uncover distinct customer personas based on real purchasing patterns—not guesses. Then you tailor everything to match what each segment actually wants.
How Segmentation Works With MBA
Customer segmentation divides your audience into groups with similar behaviors. MBA provides the data that makes this segmentation powerful and accurate.
Instead of broad demographics like “age 25-35,” you get behavioral groups like “customers who buy fitness equipment plus recovery products” or “bargain hunters who always buy on sale.” These groups reflect actual purchasing decisions, not assumptions.
MBA combined with customer segmentation classifies customers based on purchasing behaviors and product affinities. This reveals which segments exist in your store and what motivates each one. A segment that always buys complementary products together behaves differently than one that buys random items.
The insight matters because retention strategies that work for one segment fail for another. Someone who buys premium items monthly doesn’t respond to clearance emails. Someone who buys during sales doesn’t engage with full-price marketing.
Creating Segments From Purchase Patterns
Your transaction data contains natural groupings waiting to be discovered. Here’s what effective segments typically look like:
- Premium loyalists: High-value purchases, consistent buying, minimal discounting needed
- Deal seekers: Price-sensitive, seasonal purchases, respond to promotions
- Experiential buyers: Try different products, responsive to recommendations, varied purchase sizes
- Bundle buyers: Purchase complementary items, benefit from bundled offers
- Seasonal shoppers: Predictable purchasing windows, dormant between seasons
Advanced customer segmentation using machine learning analyzes buying patterns to group customers accordingly. This automated approach handles complexity better than manual segmentation as your store grows.
Each segment requires different retention tactics. Premium loyalists need VIP treatment and early access to new products. Deal seekers need alerts about sales matching their categories. Experiential buyers need fresh recommendations based on their browsing and purchase history.
Below is a summary of common customer segments identified using MBA and how to retain each:
| Segment Name | Core Buying Behavior | Effective Retention Tactic |
|---|---|---|
| Premium Loyalists | High spend, repeat purchases | Early access, exclusive offers |
| Deal Seekers | Price-sensitive, promotion-driven | Timely sales alerts, bundle deals |
| Experiential Buyers | Diverse products, discovery-focused | Personalized recommendations |
| Bundle Buyers | Shop combinations, complementary items | Highlight bundles and add-ons |
| Seasonal Shoppers | Shop by season, irregular cycles | Event-based reminders, previews |
Personalized Marketing That Works
When you know your segments, your marketing becomes infinitely more relevant. You’re no longer broadcasting one message to thousands of people. You’re speaking directly to specific groups about what they actually care about.
Consider email engagement. One segment might open promotional emails at 40% rates. Another segment opens product recommendation emails at 55% rates but ignores sales announcements. Sending the right message type to each segment increases engagement dramatically.
Retention improves when customers feel understood. A customer receives recommendations aligned with their purchase history, not random suggestions. They see offers that match their spending level, not irrelevant discounts. They’re contacted at their preferred frequency through their preferred channels.
Customer segmentation powered by MBA transforms generic marketing into targeted conversations that reduce churn and increase loyalty.
Key retention actions by segment:
- Premium loyalists: Exclusive previews, loyalty rewards, personal service
- Deal seekers: Timely sale alerts, clearance notifications, bundle discounts
- Experiential buyers: Personalized recommendations, cross-category suggestions
- Bundle buyers: Bundle promotions, complementary product highlights
The result is measurable. Stores implementing segment-based retention strategies see churn reduction of 15-25% within the first six months as customers receive increasingly relevant communications.
Pro tip: Start with two core segments based on your MBA data: high-value customers and price-sensitive customers. Tailor retention messaging to each before expanding to five or more segments.
Common challenges and mistakes to avoid with MBA
Market basket analysis sounds simple in theory. Your data tells a story about what sells together. But implementing MBA effectively is harder than most store owners expect. The gap between running an analysis and acting on useful insights catches most people off guard.
Understanding the pitfalls before you start saves months of wasted effort and bad decisions based on misleading patterns.
The Data Quality Problem
Garbage in, garbage out. This old saying still applies to MBA. If your transaction data is messy—missing product categories, inconsistent naming, or duplicate entries—your analysis produces worthless patterns.
Many stores underestimate data preparation. You might spend 70% of your time cleaning data before analysis even begins. Products listed as “running shoe,” “running shoes,” and “shoe-running” appear as three different items. Your MBA then treats them as unrelated products.
Data quality issues multiply with scale. A small store with 100 products might miss these problems. A store with 5,000 products has countless naming variations hiding in the system. Overlooking data quality creates misleading insights that seem valid but lead to poor business decisions.
Validate your data before analysis:
- Standardize product names across all records
- Check for duplicates and consolidate them
- Verify category assignments are consistent
- Remove incomplete transactions with missing information
- Test data against business reality by spot-checking patterns
Mistaking Correlation for Causation
Just because two products sell together doesn’t mean one causes the other. This is the biggest conceptual mistake e-commerce owners make with MBA.
Imagine your analysis shows that customers who buy winter coats also buy snow boots. You think they’re related, so you create a bundle. But what if both products spike during winter regardless of each other? They correlate with season, not with each other.
Another trap: bestsellers appear together because everyone buys them. Product A sells 10,000 units monthly. Product B sells 9,000 units monthly. Of course they appear in many transactions together—almost everything appears with bestsellers.
Common mistakes include misapplying association rules without considering business context. A statistically significant pattern might be completely irrelevant to your business.
Always ask these questions about patterns:
- Does it make intuitive sense? Would customers rationally want these together?
- Is it seasonal? Do both products peak at the same time independently?
- Are they just popular? Would they appear together anyway because they’re bestsellers?
- Could it be a promotion effect? Did you run a deal on both items simultaneously?
Ignoring Seasonality and Trends
Product relationships change with seasons, holidays, and trends. An analysis based on full-year data misses these shifts. Winter clothing bundles make sense in January but fail in July.
Your MBA needs context about timing. Analyzing summer data might show that tank tops and shorts always appear together. But this relationship disappears in winter. Creating a year-round bundle based on summer data wastes inventory and confuses customers.
Thresholds That Miss Real Patterns
MBA uses support and confidence thresholds to filter noise. Support means “how often does this combination appear?” Confidence means “when Product A is bought, how often is Product B also bought?”
Set these thresholds too high and you miss valuable niche patterns. A product combination appearing in only 2% of transactions seems insignificant. But if profit margin is 40%, that 2% still drives real revenue from a smaller customer segment.
Set thresholds too low and you get flooded with useless patterns that don’t drive business value.
The best MBA insights balance statistical significance with practical business relevance—not everything that appears in data deserves action.
Common threshold mistakes:
- Too strict: Requiring 10% support eliminates niche combinations with high profit
- Too loose: Accepting 0.5% support generates thousands of meaningless patterns
- Ignoring confidence: Finding pairs that appear together but lack strong directionality
- No profit weighting: Treating all products equally instead of prioritizing high-margin items
Acting Without Validation
Your MBA analysis shows a pattern. Now what? Many store owners implement recommendations immediately without testing. This creates real problems when the pattern doesn’t actually drive sales.
A better approach tests recommendations first. Create a bundle based on MBA insights. Run it for two weeks. Measure conversion rates, average order value, and customer satisfaction. Only scale if results justify it.
Pro tip: Validate your top 3-5 MBA patterns with small tests before implementing store-wide. Measure actual conversion and profit impact, not just statistical correlation.
Unlock True Sales Growth and Customer Loyalty With Data-Driven Market Basket Analysis
Recognizing the challenges of making sense of complex transaction data and the frustration of guessing which products sell best together can hold your e-commerce store back from reaching its full potential. If you want to stop missing out on valuable product bundling and cross-selling opportunities or struggling to create meaningful customer segments tailored to real purchasing behavior, it is time to turn to powerful, automated insights. Market basket analysis and customer segmentation are the keys to growing average order values and boosting retention without the need for advanced data science skills.

Transform your data into actionable strategies with Affinsy. Our AI-powered platform analyzes your store’s historical sales to uncover hidden product relationships, identify high-impact bundles, and reveal customer segments that drive loyalty. Seamlessly integrating with Shopify, WooCommerce, and Google Analytics, Affinsy delivers easy-to-understand reports and dashboards designed for e-commerce owners and marketing managers who want to take control of their growth. Don’t wait to optimize your bundling and retention strategy based on solid market basket analysis insights. Explore how you can increase your average order value and enhance customer satisfaction today by visiting Affinsy’s homepage. The future of smarter selling starts now.
Frequently Asked Questions
What is market basket analysis (MBA) in e-commerce?
Market basket analysis is the process of examining transaction data to identify patterns in how customers purchase items together, revealing which products are frequently bought in the same transactions.
How can MBA improve product bundling strategies?
MBA helps identify products that customers often buy together, allowing e-commerce businesses to create compelling bundles that enhance perceived value and encourage higher sales.
What are the key methods used in market basket analysis?
The two main methods are algorithmic approaches, such as the Apriori and FP-Growth algorithms, which find patterns, and statistical enhancement methods that validate those patterns’ significance.
How does MBA support customer segmentation for improved retention?
MBA provides insights into distinct purchasing behaviors, allowing businesses to segment customers based on their buying patterns. This enables tailored marketing strategies that align with the preferences and trends of each segment.
Recommended
- Role of AI in E-Commerce: Boosting Sales and Retention - Affinsy Blog | Affinsy
- Data-Driven Decision Making in Ecommerce: Maximizing Sales and Retention - Affinsy Blog | Affinsy
- Role of Predictive Analytics: Driving E-commerce Growth - Affinsy Blog | Affinsy
- Developing a Marketing Strategy to Maximize E-commerce Sales - Affinsy Blog | Affinsy
- Role of POS in Retail – Driving Efficiency and Growth
- DropPop | AI Marketplace Dropshipping