
TL;DR:
- Personalization-driven brands generate 40% more revenue than competitors.
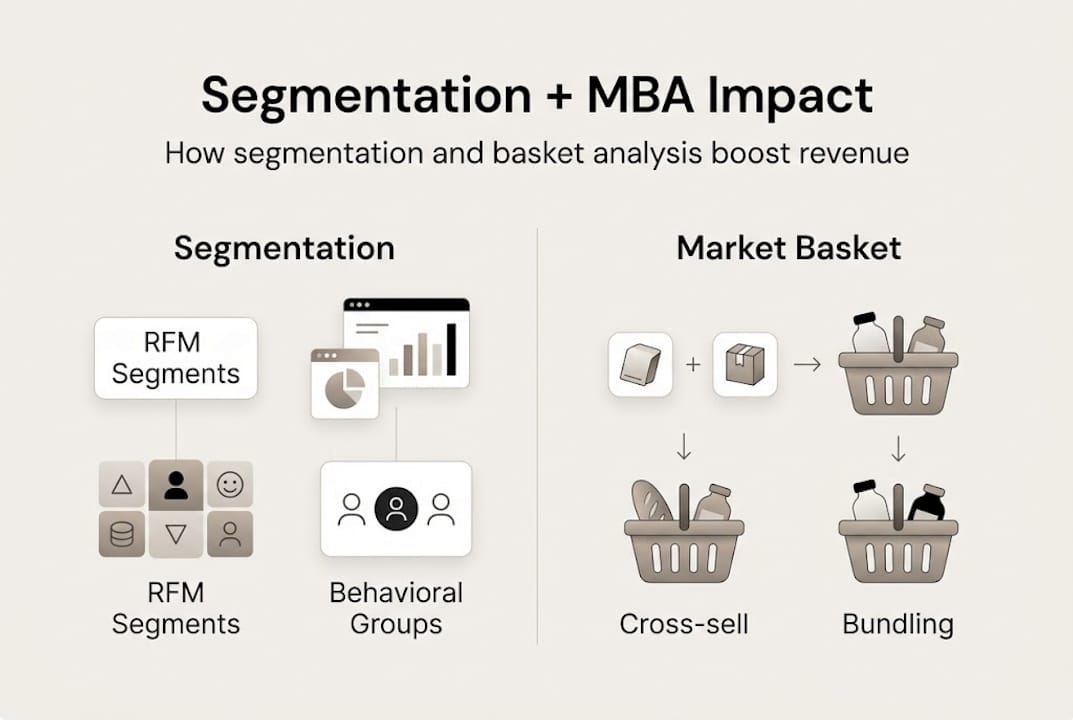
- Behavioral segmentation and market basket analysis optimize product bundling and cross-selling.
- Using behavioral data and MBA consistently outperforms demographic-based strategies in e-commerce.
Brands that lead in personalization generate 40% more revenue than their competitors. Yet most mid-to-large e-commerce teams still run the same promotions to their entire customer list, wondering why conversion rates plateau. The gap between average and exceptional marketing performance almost always comes down to one thing: how well you understand your customers and what they actually buy together. This article breaks down how segmentation and market basket analysis (MBA) work together to power smarter product bundling, sharper cross-selling, and campaigns that drive real revenue growth.
Table of Contents
- What is segmentation in marketing?
- The segmentation process: From data to action
- How market basket analysis enhances segmentation
- Product bundling and cross-selling: Real impact of segmentation and MBA
- Why behavioral data and MBA beat basic demographics every time
- Drive growth with advanced segmentation and MBA tools
- Frequently asked questions
Key Takeaways
| Point | Details |
|---|---|
| Segmentation boosts revenue | Effective segmentation strategies can increase personalized revenue by up to 40%. |
| MBA finds true purchase affinities | Market basket analysis uncovers patterns that enable smarter bundling and cross-selling for higher profits. |
| Behavioral data beats demographics | Segmenting by behavior or RFM delivers better results than relying on demographic data alone. |
| 80% of top retailers use MBA | Most leading brands leverage market basket analysis in tandem with segmentation for competitive advantage. |
What is segmentation in marketing?
Market segmentation divides a broad customer base into distinct groups that share common characteristics, so you can build targeted strategies for each group instead of broadcasting one message to everyone. In e-commerce, this is the difference between sending a blanket 10% off email and sending a curated bundle recommendation to customers who have already shown purchase intent in a specific category.
There are five main segmentation types you should know:
- Demographic: Age, gender, income, education. Easy to collect, but weak as a standalone predictor.
- Geographic: Location, region, climate. Useful for logistics and seasonal campaigns.
- Psychographic: Values, lifestyle, interests. Harder to measure but powerful for brand positioning.
- Behavioral: Purchase history, browsing patterns, loyalty status. The strongest signal for e-commerce.
- Firmographic: Company size, industry, revenue. Primarily used in B2B or SaaS contexts.
Here is a quick comparison of how these types stack up in practice:
| Segmentation type | Data source | Predictive power | Best use case |
|---|---|---|---|
| Demographic | CRM, surveys | Low to medium | Broad targeting |
| Geographic | IP, shipping data | Medium | Regional campaigns |
| Psychographic | Surveys, social | Medium | Brand messaging |
| Behavioral | Transaction logs | High | Personalized offers |
| Firmographic | CRM, LinkedIn | High (B2B) | Account-based marketing |
Behavioral segmentation consistently outperforms the others for e-commerce because it is grounded in what customers actually do, not what they say they prefer. A 45-year-old in Chicago and a 28-year-old in Austin might both buy premium coffee equipment, but their purchase sequences, basket sizes, and repurchase timing tell you far more about how to market to them than their zip codes ever could.
Segmentation enables tailored campaigns that speak directly to each customer group’s needs, dramatically improving engagement and conversion rates compared to one-size-fits-all messaging.
The practical takeaway: start with behavioral data as your primary segmentation layer. Layer in demographics or geography only when they add meaningful context to the behavioral signal.
The segmentation process: From data to action
Knowing the types of segmentation is one thing. Executing it without wasting weeks on data cleanup is another. Effective segmentation follows a clear sequence: define your objective, segment the data, analyze each group, develop targeted strategies, and test performance before scaling.
Here is how that looks in practice for an e-commerce team:
- Define your objective. Are you trying to reduce churn, increase average order value (AOV), or reactivate lapsed buyers? Your goal determines which segmentation type to prioritize.
- Collect and clean your data. Export transaction data from Shopify, WooCommerce, or any order management system. Remove duplicates, standardize product naming, and ensure timestamps are consistent.
- Segment the data. Apply your chosen method. For behavioral segmentation, RFM scoring (recency, frequency, monetary value) is a reliable starting point. Assign each customer a score across all three dimensions.
- Analyze each segment. Look at AOV, purchase frequency, product category preferences, and churn risk. Identify which segments are most valuable and which are at risk.
- Develop targeted strategies. Build campaigns, bundle offers, or loyalty incentives tailored to each segment’s behavior profile.
- Test and iterate. Run A/B tests within segments before rolling out changes broadly. Measure lift against a control group.
Here is a comparison of what different segment types reveal and what actions they enable:
| Segment type | Key characteristics | Actionable outcome |
|---|---|---|
| High RFM score | Recent, frequent, high spend | Upsell, loyalty rewards |
| Low recency | Hasn’t purchased in 90+ days | Win-back campaign |
| High frequency, low spend | Buys often but small baskets | Bundle promotions |
| One-time buyers | Single purchase, no return | Onboarding sequence |
Pro Tip: Do not stop at demographic filters when building segments. Customers who bought a product in the last 30 days and have a basket size above your median are a far more actionable group than “women aged 25 to 40.” Behavioral indicators give you segments you can actually do something with today.
The segmentation process is not a one-time project. Customer behavior shifts with seasons, promotions, and market conditions. Build a cadence for refreshing your segments, at minimum quarterly for stable catalogs and monthly for fast-moving product lines.

How market basket analysis enhances segmentation
Once you have clean segments, the next question is: what should you actually offer each group? This is where market basket analysis changes the game. MBA analyzes transaction data to find which products customers buy together, giving you a data-driven foundation for bundling and cross-sell recommendations instead of relying on gut instinct.
The two most common algorithms behind MBA are:
- Apriori: Scans transaction records to find item sets that appear together above a minimum frequency threshold. Simple and interpretable, but slower on very large datasets.
- FP-Growth (Frequent Pattern Growth): A faster alternative that compresses transaction data into a tree structure before mining. Better suited for catalogs with thousands of SKUs.
Both algorithms output three key metrics:
- Support: How often two items appear together in all transactions.
- Confidence: Given that a customer bought item A, how likely are they to also buy item B?
- Lift: How much more likely the co-purchase is compared to random chance. A lift above 1.0 means there is a real affinity.
You can explore the full methodology in our market basket analysis guide and see how to apply it to boost revenue in our post on how to increase AOV with MBA.
Pro Tip: Always filter your MBA results by lift greater than 1.0. A high confidence score alone can be misleading if the second item is simply a best-seller that appears in most baskets anyway. Lift tells you whether the association is genuine or just coincidental.
When you layer MBA on top of your behavioral segments, the results sharpen considerably. A high-RFM segment that frequently buys running shoes might show strong lift between shoe purchases and performance socks. That insight feeds directly into your next email campaign, your product page recommendations, and your checkout upsell logic.
Product bundling and cross-selling: Real impact of segmentation and MBA
The combination of segmentation and MBA is not just theoretically appealing. The numbers back it up. Bundling and cross-selling driven by MBA raises AOV by 15 to 18% and can lift total revenue by up to 35% when applied consistently across customer touchpoints.
Here is how the impact breaks down across common bundling and cross-sell tactics:
| Tactic | MBA input | Expected AOV lift | Best segment to target |
|---|---|---|---|
| Product bundles | High-lift item pairs | 15 to 18% | High frequency, low spend |
| Checkout cross-sell | Confidence-ranked add-ons | 10 to 15% | One-time buyers |
| Post-purchase email | Next likely purchase | 8 to 12% | Recent buyers |
| Loyalty tier offers | Segment-specific bundles | 20%+ | High RFM customers |
Real-world bundling examples show how this plays out:
- A home goods retailer notices high lift between cast iron skillets and seasoning oils. They create a “starter bundle” and feature it on the product page. AOV for that category increases by 17% within 60 days.
- A supplement brand identifies that customers who buy protein powder within their first order have a 68% confidence rate of buying a shaker bottle within the next two weeks. They add a shaker as a post-purchase email recommendation. Repeat purchase rate climbs.
- An electronics retailer uses MBA to find that laptop buyers frequently add a specific brand of laptop sleeve within the same session. They surface the sleeve as a “frequently bought together” item at checkout.
The brands winning in 2026 are not guessing at bundles. They are reading their transaction data and letting purchase patterns tell them exactly what to offer and when.
For a step-by-step walkthrough, see our MBA step-by-step example. If you want to explore how this applies to emerging commerce models, our piece on agentic commerce bundling covers the next frontier.
Why behavioral data and MBA beat basic demographics every time
After working through hundreds of segmentation rollouts with mid-to-large e-commerce clients, one pattern stands out clearly: teams that anchor their segmentation in demographic data alone consistently underperform those that lead with behavioral signals and MBA.
Demographic data tells you who your customer is on paper. Behavioral data predicts what they will do next. That distinction matters enormously when you are deciding where to allocate campaign budget or which bundle to promote.
The brands pulling ahead right now are doing three things differently. First, they use RFM scoring as a baseline and refresh it monthly. Second, they run MBA on each high-value segment separately, not on their entire customer base as a single pool. Running MBA on your top 20% of customers by revenue often surfaces completely different product affinities than running it on the full list. Third, they test for causation, not just correlation. A high-lift score between two products is a hypothesis, not a guarantee. The best teams validate it with a controlled promotion before scaling.
The uncomfortable truth is that demographic segmentation feels safe because the data is easy to collect. But easy data rarely gives you a competitive edge. The brands that invest in the role of MBA in ecommerce and behavioral segmentation are the ones compounding revenue gains quarter over quarter, while competitors keep recycling the same broad campaigns.
Drive growth with advanced segmentation and MBA tools
If the strategies above resonate, the next step is putting them into practice with tools built for exactly this kind of analysis. Affinsy makes advanced segmentation and market basket analysis accessible without requiring a data science team.

You can start by exploring the market basket analysis resources in Affinsy’s glossary to ground your team in the core concepts, then check the customer segmentation glossary to align on terminology before building your first segments. When you are ready to run your own analysis, the Affinsy platform offers a permanent free tier covering up to 20K line items with no credit card required. Upload your transaction data via CSV, connect through the API, or use MCP, and start surfacing the product affinities and customer patterns already hidden in your data.
Frequently asked questions
What is the difference between segmentation and market basket analysis?
Segmentation divides your customer base into groups for targeted marketing, while MBA identifies co-purchase patterns within transaction data to sharpen your offers and recommendations. They work best when used together.
How does market basket analysis improve product bundling?
MBA surfaces which products customers frequently buy together, giving you the data to build bundles that feel natural to the buyer and drive higher transaction values rather than guessing at combinations.
Which segmentation type delivers the best results for ecommerce?
Behavioral and RFM segmentation consistently outperform basic demographics in predicting purchase behavior, because they are grounded in what customers actually do rather than who they appear to be on paper.
What metrics should I track when using segmentation and MBA?
Focus on AOV, revenue uplift, segment engagement rates, and bundle conversion rates. MBA-driven bundling gives you a clear baseline to measure lift against so you know exactly what is working.
Recommended
- From Clicks to Insights: Using Market Basket Analysis Beyond the Shopping Cart - Affinsy Blog | Affinsy
- How a DTC Supplement Brand Increased AOV 28% Using Market Basket Analysis on Shopify - Affinsy Blog | Affinsy
- Market Basket Analysis Guide: Boost Your Sales Effectively - Affinsy Blog | Affinsy
- Role of MBA in Ecommerce: Driving Sales and Retention - Affinsy Blog | Affinsy
- Why consolidate sales processes: 20% revenue growth