
TL;DR:
- Boosting AOV is a quick way to grow revenue but requires balancing order value increases with maintaining conversion rates. Analyzing customer segments and utilizing data-driven bundling strategies helps achieve sustainable growth without sacrificing revenue per session. Continuous monitoring of key metrics ensures effective iterations and long-term Shopify store success.
Boosting your Shopify store’s average order value is one of the fastest ways to grow revenue without spending more on customer acquisition. But here’s the trap many marketing managers fall into: you raise prices, bundle aggressively, or add upsells everywhere, and your AOV climbs, but your overall revenue quietly drops because AOV gains can trap RPS when conversion rates take the hit. This guide gives you a structured, data-backed approach to increase AOV on Shopify while protecting the metrics that actually determine your bottom line.
Table of Contents
- Understand the real impact of AOV on Shopify stores
- Preparation: Audit your current AOV and customer segments
- Execution: Product bundling and upsell strategies that work
- Verification: Track, analyze, and iterate for sustainable gains
- A smarter approach to Shopify AOV: What most guides ignore
- Unlock accelerated AOV growth with smarter analytics
- Frequently asked questions
Key Takeaways
| Point | Details |
|---|---|
| Balance AOV with conversion | Monitor both AOV and conversion rates together to ensure real revenue growth. |
| Segment and analyze | Segment your Shopify customers and use analytics to uncover bundling opportunities. |
| Launch data-driven bundles | Design product bundles based on purchase data to effectively lift AOV. |
| Track and iterate | Continuously track results and refine strategies to maximize average order value sustainably. |
| Focus on real per-session revenue | Always measure revenue per session as the true health metric after AOV initiatives. |
Understand the real impact of AOV on Shopify stores
Average order value is calculated simply: divide total revenue by the number of orders in a given period. If your store generates $50,000 from 1,000 orders in a month, your AOV is $50. Simple math, but the implications of moving that number up or down ripple through every part of your business.
Optimizing average order value matters because your customer acquisition cost (CAC) stays fixed regardless of what a customer buys. When you raise AOV, you extract more value from every visitor you’ve already paid to attract. That’s why even a 10% AOV increase can translate to a disproportionate jump in net profit margin.
The danger is when AOV becomes the only metric on the dashboard. Imagine you add a mandatory product bundle at checkout. AOV jumps from $50 to $65. Looks great. But the forced bundle frustrated buyers, and your conversion rate dropped from 3.5% to 2.4%. Let’s look at what actually happens to revenue per session (RPS):
| Scenario | AOV | Conversion rate | Revenue per session |
|---|---|---|---|
| Baseline | $50 | 3.5% | $1.75 |
| After bundle push | $65 | 2.4% | $1.56 |
| Optimized bundle | $65 | 3.3% | $2.15 |
Watch this number carefully: Revenue per session is the single metric that tells you whether an AOV increase is actually helping or quietly destroying your store’s growth. A rising AOV and a falling RPS is never a win.
The “optimized bundle” scenario above is what this guide aims to get you to. As maximize AOV methods show, the most sustainable gains come from strategies that lift both order size and purchase confidence simultaneously, not one at the expense of the other.
Preparation: Audit your current AOV and customer segments
Before you run a single promotion, you need a clear picture of where you are. Skipping this step is how brands end up layering ineffective tactics on top of a broken foundation.
Start with Shopify’s built-in analytics. Pull your AOV trend over the past 90 days alongside your store conversion rate. Note the relationship: do they move together, or does one dip when the other rises? This correlation is your early warning system. If you don’t see a clean correlation, your store likely has AOV variance across different customer segments, and that’s actually useful data.
Next, segment your customers by behavior. Shopify’s analytics breaks customers into first-time buyers, returning buyers, and high-value customers. The steps to audit AOV across these groups often reveal that returning customers spend 30 to 50% more per order than first-time visitors. That changes your bundling strategy entirely: aggressive bundles for new visitors may hurt conversion, while the same bundle offered to loyal customers might perform extremely well.
Here’s a side-by-side comparison of doing this work manually versus using an automated tool:
| Approach | Time required | Accuracy | Actionability |
|---|---|---|---|
| Manual Shopify export + spreadsheet | 4 to 8 hours per audit | Medium (human error risk) | Low (static snapshot) |
| Automated analytics platform | 20 to 45 minutes setup | High (real-time data) | High (dynamic segmentation) |
| Hybrid (CSV + AI analysis) | 1 to 2 hours | High | High |
Key data points to collect during your audit:
- Baseline AOV by customer segment (new vs. returning)
- Conversion rate by traffic source and device type
- Top 20 products by order frequency and attach rate
- Revenue per session across your last 3 promotional periods
- Cart abandonment rate before and after upsell prompts
Understanding retail analytics for AOV at this depth is what separates brands that grow methodically from those that are constantly guessing why a campaign underperformed.
Pro Tip: Use market basket analysis on your historical order data to find which product combinations customers already buy together organically. These naturally occurring pairs are your best candidates for formal bundles because you’re formalizing buying behavior rather than trying to force new habits.
Execution: Product bundling and upsell strategies that work
Now you have the data. Time to build something with it. Here’s a step-by-step process that balances AOV growth with conversion rate protection.
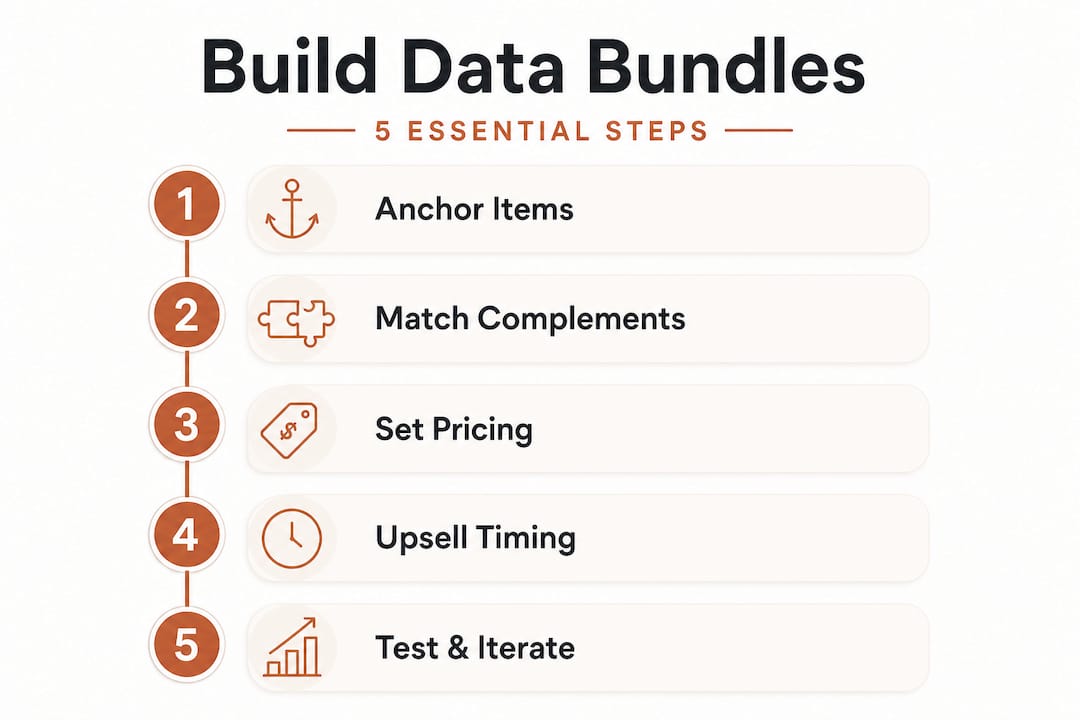
Step 1: Identify your anchor products. These are high-frequency items that appear in the largest number of orders. They anchor a bundle because customers already want them. Your job is to attach complementary items to them at a value that makes the bundle feel like a deal, not a forced add-on.
Step 2: Match complements using co-purchase data. Don’t guess which products go together. Use your market basket data. If 40% of customers who buy Product A also buy Product B within the same session, that’s a strong signal. If that number is below 15%, the pairing is weaker and may not justify a bundle.

Step 3: Set bundle pricing with a clear perceived discount. Customers respond to bundles when they see a concrete saving. A 10 to 15% discount on the combined price typically maximizes AOV without eroding margin. Going below 10% feels negligible; above 20% often signals to buyers that something is wrong with the products.
Step 4: Choose your upsell moment carefully. There are three primary upsell windows: pre-cart (product page), in-cart, and post-purchase. Product bundling strategies that convert best on Shopify tend to show bundles on the product page itself, where purchase intent is still forming. Post-purchase upsells protect conversion rate because the first purchase is already locked in.
Step 5: Test before scaling. Never roll a bundle out store-wide without a test. Use a small traffic segment first.
Here’s how the three main AOV tactics compare:
| Strategy | Average AOV lift | Conversion rate risk | Best use case |
|---|---|---|---|
| Product bundle | 15 to 25% | Medium | Complementary products |
| Cross-sell (cart page) | 8 to 12% | Low | Accessories, add-ons |
| Upsell (product page) | 10 to 20% | Medium to high | Premium versions |
Common pitfalls to avoid when executing these strategies:
- Overloading the cart page with multiple upsell prompts creates decision fatigue and raises abandonment rates
- Discounting too aggressively trains customers to wait for deals before buying
- Ignoring mobile UX on bundle displays, which often appear broken on smaller screens
- Bundling slow-moving inventory with your best sellers, which can taint the perceived value of your top products
The most complete resource for master bundling strategies confirms that the brands seeing sustainable AOV gains treat bundling as a customer experience decision first and a revenue optimization tactic second. When a bundle genuinely makes a customer’s life easier, conversion rates stay intact.
For Shopify-specific implementation details, the data-driven bundles on Shopify playbook covers app selection, variant configuration, and A/B test setup in detail.
Pro Tip: Run A/B pricing tests on your bundles before committing to a discount level. Test a 10% and a 15% discount version simultaneously on similar traffic segments. The goal is to find the price point where AOV and conversion rate both improve, which is often not the deepest discount. Strong cross-selling strategies work because they add genuine value, not just because they’re cheap.
Verification: Track, analyze, and iterate for sustainable gains
Launching a bundle or upsell campaign without a clear verification plan is like driving without a speedometer. You might be going fast, but you have no idea if you’re actually making progress.
These are the core metrics to track after every AOV initiative:
- AOV (7-day rolling average): Your primary output metric
- Conversion rate (CVR): Your protection metric; if this drops, investigate immediately
- Revenue per session (RPS): Your single source of truth for whether the initiative is working
- Customer lifetime value (LTV): Your long-range indicator; bad bundle experiences reduce repeat purchase rates
- Cart abandonment rate: A leading indicator of friction introduced by upsell prompts
Here’s a sample analytics tracking table to monitor performance over a 30-day campaign window:
| Week | AOV | Conversion rate | Revenue per session | Cart abandonment |
|---|---|---|---|---|
| Pre-launch baseline | $52 | 3.4% | $1.77 | 68% |
| Week 1 | $59 | 3.1% | $1.83 | 71% |
| Week 2 | $61 | 3.0% | $1.83 | 72% |
| Week 3 | $63 | 3.2% | $2.02 | 69% |
| Week 4 | $64 | 3.3% | $2.11 | 68% |
Notice what happened in weeks 1 and 2 in the table above. AOV went up, but RPS barely moved because conversion rate slipped. That’s the signal to adjust your bundle presentation or pricing, not to keep pushing. By week 3, after a bundle redesign, both metrics improved together. This is the iterative cycle that produces lasting results.
Warning: If your RPS drops while AOV rises, you are losing revenue in real terms. This is the most common and most overlooked mistake in AOV optimization, and it happens most often when teams report on AOV without monitoring conversion rate in the same view.
Post-launch analysis should follow a consistent structure. Pull your RPS comparison for the 30 days before and after launch. If RPS improved, scale the initiative. If it didn’t move or dropped, identify which segment or channel is dragging performance and run a targeted fix before scaling. The AOV maximization best practices that separate growing brands from stagnant ones come down to this discipline: measure everything, act on evidence, and iterate fast.
A smarter approach to Shopify AOV: What most guides ignore
Here’s the uncomfortable reality about most AOV advice circulating online: it treats order value as a goal in itself. Add a free shipping threshold, force a bundle, push an upsell popup at checkout. AOV goes up, everyone celebrates, and nobody checks whether RPS actually improved.
We’ve seen brands run campaigns that lifted AOV by 18% over a quarter while their total monthly revenue declined because the conversion rate quietly bled out in the background. That’s not a win. That’s a measurement failure dressed up as a success.
The brands that build real, compounding AOV growth share one characteristic: they run high-velocity, small-scope experiments with a short feedback loop. Instead of a big seasonal bundle launch, they test one bundle variant on one product category for two weeks. They check RPS. They check CVR. They either scale it or scrap it and move on. This approach means more experiments per year, more learning, and faster iteration than any competitor who runs two or three major campaigns annually.
Another thing most guides ignore is the customer experience dimension. Upsells and bundles that feel relevant and useful to the buyer generate higher conversion rates and higher AOV at the same time. The analytics-driven AOV gains that look impressive on a dashboard are almost always the ones where the brand understood what their customers genuinely needed next, not what the brand needed to move out of warehouse.
Pro Tip: Set up a weekly RPS dashboard that sits alongside your AOV report. If any change you make causes RPS to drop two weeks in a row, treat that as an automatic rollback trigger. This simple rule will save you from the most common and costly AOV mistake in e-commerce.
The discipline to prioritize RPS over raw AOV, combined with relentless small-scale experimentation, is what separates the Shopify stores growing 40% year over year from the ones that plateau and blame the algorithm.
Unlock accelerated AOV growth with smarter analytics
Turning the strategies in this guide into consistent revenue gains requires the right data infrastructure behind your decisions. Affinsy gives Shopify marketing teams AI-powered market basket analysis and RFM customer segmentation built specifically to surface the product combinations and customer patterns that drive real AOV growth.

You don’t need a data science team to get started. Export your Shopify order data as a CSV and upload it directly, or connect via API for continuous analysis. Affinsy’s free tier supports up to 20,000 line items with full access to all features, no credit card required. When you’re ready to scale, Pro starts at $49 per month.
Explore how bundling and AOV analytics work inside the platform, and see how leading brands use data-driven bundling playbooks to build bundles their customers actually want. Start your free analysis at affinsy.com today.
Frequently asked questions
What is average order value (AOV) on Shopify?
Average order value is the average dollar amount spent each time a customer places an order on your Shopify store, calculated by dividing total revenue by total number of orders in a period.
How do product bundles increase AOV?
Bundling complementary products encourages customers to spend more in a single transaction, thus raising your store’s overall AOV by making a larger purchase feel like better value than buying each item separately.
What’s the main risk of only focusing on AOV?
Raising AOV without monitoring conversion rate can lower total site revenue, since CVR drops can cancel out any gains from higher order values when measured through revenue per session.
Which metrics should I monitor to ensure sustainable AOV growth?
Track AOV, conversion rate, and revenue per session together after any pricing or bundling change, and add customer LTV as a longer-range health check for your strategy.
How frequently should I re-evaluate my bundling strategies?
Review bundle performance monthly at minimum, and set up weekly RPS snapshots so you can catch conversion rate erosion early and adapt to shifting customer buying patterns before they cost you significant revenue.
Recommended
- How to Improve Average Order Value with Data-Driven Bundling - Affinsy Blog | Affinsy
- Master Product Bundling on Shopify for Increased Sales - Affinsy Blog | Affinsy
- What is product bundling? Boost e-commerce AOV by 50% - Affinsy Blog | Affinsy
- The DTC Bundling Playbook: How to Build Data-Driven Product Bundles That Actually Increase AOV on Shopify - Affinsy Blog | Affinsy