
Running an ecommerce store without tracking key performance indicators is like navigating a ship without a compass. You might move forward, but you have no idea if you’re heading toward profit or sailing straight into losses. Many online retailers launch promotions, adjust pricing, and invest in ads based on gut feeling rather than hard data. Tracking the right ecommerce KPIs is crucial for optimizing sales strategies and improving customer retention. This guide breaks down the essential metrics every ecommerce manager and analyst should monitor in 2026 to transform raw data into actionable growth strategies.
Table of Contents
- Why Ecommerce KPIs Are Vital For Your Online Store
- Top Ecommerce KPIs Every Manager Should Track In 2026
- How Analytics Platforms Enhance KPI Tracking And Decision Making
- Applying Ecommerce KPIs To Improve Sales Strategies And Customer Retention
- Optimize Your Ecommerce Growth With Affinsy
- Frequently Asked Questions
Key takeaways
| Point | Details |
|---|---|
| KPIs drive strategic decisions | Monitoring the right metrics reveals what’s working and where resources are wasted |
| Core metrics matter most | Focus on conversion rate, customer lifetime value, and cart abandonment for maximum impact |
| Analytics platforms streamline tracking | Automated dashboards reduce manual errors and speed up decision cycles |
| Data informs retention strategies | Customer segmentation based on KPIs enables personalized marketing that builds loyalty |
| Regular review cycles optimize performance | Weekly, monthly, and quarterly KPI analysis keeps strategies aligned with business goals |
Why ecommerce KPIs are vital for your online store
Every ecommerce business generates mountains of data, but data without context is just noise. KPIs transform that noise into a clear signal, showing you exactly where your sales funnel succeeds and where it leaks revenue. Without these metrics, you’re essentially throwing darts blindfolded, hoping something sticks.
Think of KPIs as your business compass. They provide visibility into sales effectiveness, customer behavior patterns, and operational efficiency. When you know your conversion rate is dropping on mobile devices, you can fix the checkout experience. When customer lifetime value trends downward, you know retention needs immediate attention. These insights eliminate guesswork and replace it with evidence.
KPIs tell you what’s working, what’s leaking cash, and where to double down.
The benefits of systematic KPI tracking extend across your entire operation:
- Identify which marketing channels deliver profitable customers versus vanity traffic
- Spot inventory issues before stockouts damage customer trust
- Optimize pricing strategies based on actual purchase behavior
- Allocate advertising budget to campaigns that generate real returns
For ecommerce managers juggling multiple responsibilities, KPIs create focus. Instead of reacting to every fluctuation, you can concentrate on the ecommerce metrics store owners must track that actually move the needle. This focused approach saves time, reduces stress, and delivers measurable improvements in both sales performance and customer satisfaction.
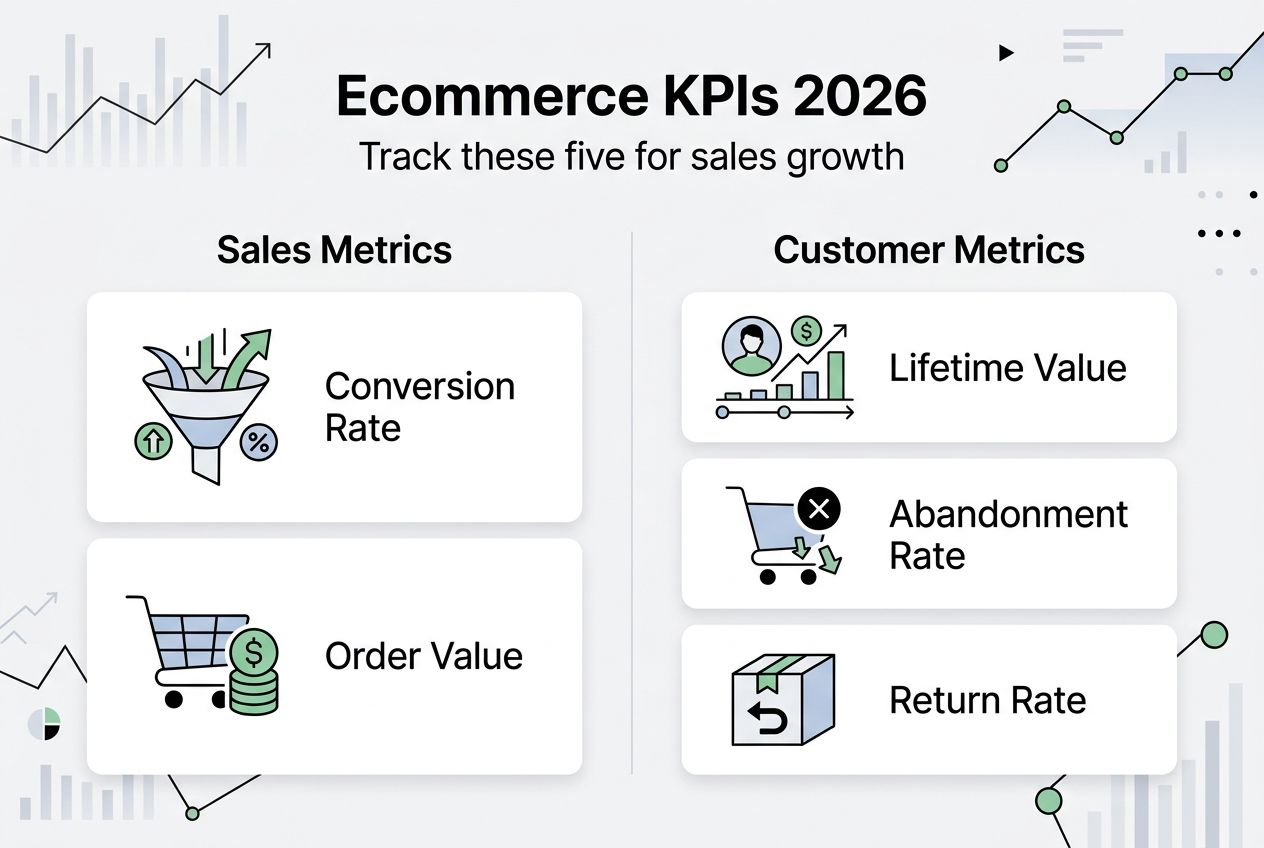
Top ecommerce KPIs every manager should track in 2026
Understanding which metrics matter most separates successful ecommerce operations from struggling ones. The following KPIs form the foundation of data-driven decision making, each revealing a different aspect of business health.
Conversion rate measures the percentage of visitors who complete a purchase. Calculate it by dividing total orders by total sessions, then multiplying by 100. A 2% conversion rate means 2 out of every 100 visitors buy something. This metric directly reflects how well your site, product pages, and checkout process work together.
Average order value shows how much customers spend per transaction. Simply divide total revenue by number of orders. If customers typically spend $50 but a promotion bumps that to $65, you’ve found a winning strategy worth repeating. This KPI guides bundling, upselling, and minimum order incentives.

Customer lifetime value predicts total revenue a customer generates over their entire relationship with your store. Multiply average purchase value by purchase frequency and average customer lifespan. A customer worth $500 over three years deserves different marketing investment than one worth $50 over six months.
Cart abandonment rate reveals how many shoppers add items but leave without buying. Calculate it as abandoned carts divided by total carts created. Rates above 70% signal friction in your checkout process, whether that’s unexpected shipping costs, complicated forms, or payment security concerns.
Return rate tracks the percentage of orders sent back. High return rates indicate product description issues, quality problems, or sizing confusion. This metric directly impacts profitability since returns cost you shipping, restocking, and lost sales.
Here’s a quick reference for these critical metrics:
| KPI | Formula | What it reveals |
|---|---|---|
| Conversion rate | (Orders / Sessions) × 100 | Sales funnel effectiveness |
| Average order value | Revenue / Number of orders | Per-transaction revenue |
| Customer lifetime value | Avg purchase × Frequency × Lifespan | Long-term customer worth |
| Cart abandonment | Abandoned carts / Total carts | Checkout friction points |
| Return rate | Returns / Total orders | Product and description quality |
Pro Tip: Don’t try to track every possible metric. Start with these five core KPIs, master them, then expand to ecommerce success metrics specific to your business model. Data overload paralyzes decision making just as badly as no data at all.
The real power emerges when you track these KPIs over time and across customer segments. A 3% conversion rate might look healthy until you discover mobile users convert at 1% while desktop users hit 5%. That insight tells you exactly where to focus improvement efforts. Understanding your guide to e-commerce data analysis helps you spot these patterns faster.
How analytics platforms enhance KPI tracking and decision making
Manually calculating KPIs in spreadsheets works for small operations, but it quickly becomes unsustainable as your business grows. Modern ecommerce analytics platforms automate the heavy lifting, transforming raw transaction data into visual dashboards that update in real time.
These platforms deliver several game-changing advantages:
- Real-time data visibility eliminates the lag between customer actions and your awareness of trends
- Customizable dashboards let you arrange KPIs by priority, so critical metrics stay front and center
- Automated alerts notify you when metrics cross thresholds, catching problems before they escalate
- Historical trend analysis reveals seasonal patterns and long-term trajectory
The best analytics tools integrate directly with your ecommerce platform, pulling data automatically from Shopify, WooCommerce, or whatever system runs your store. This integration eliminates manual data entry errors and ensures your KPIs reflect actual business performance, not stale numbers from last week.
Beyond basic tracking, advanced platforms connect KPIs to specific marketing campaigns and product performance. You can see exactly which email sequence drives the highest customer lifetime value or which product category generates the most cart abandonments. This granular visibility makes optimization straightforward instead of speculative.
Pro Tip: Choose analytics tools that grow with your business. Look for platforms offering API access, custom report builders, and data export options. You want flexibility to analyze data your way, not locked into rigid templates that don’t match your needs.
The efficiency gains from automated KPI tracking compound over time. Instead of spending hours each week compiling reports, you spend minutes reviewing insights and hours implementing improvements. This shift from reporting to action accelerates your optimization cycles and keeps you ahead of competitors still drowning in spreadsheets.
For comprehensive coverage of available solutions, explore the best ecommerce analytics tools 2026 to find platforms matching your technical requirements and budget. Pairing the right tools with solid ecommerce reporting guide optimize growth practices creates a foundation for sustainable, data-driven growth.
Applying ecommerce KPIs to improve sales strategies and customer retention
Collecting KPI data means nothing without action. The real value emerges when you translate metrics into concrete strategies that boost revenue and build customer loyalty. Here’s how to turn numbers into results.
-
Analyze conversion rate by traffic source. Break down your overall conversion rate by channel: organic search, paid ads, email, social media. If paid search converts at 4% but social media at 0.5%, reallocate budget accordingly. Don’t just chase traffic volume; chase quality traffic that actually buys.
-
Test product bundles to increase average order value. If your average order sits at $45, create bundles priced at $60 that deliver obvious value. Track whether bundled offers lift overall revenue more than individual product promotions. Small increases in average order value compound dramatically over thousands of transactions.
-
Segment customers by lifetime value for personalized campaigns. Identify your top 20% of customers by total spending. These VIPs deserve exclusive early access, special discounts, and premium service. Meanwhile, nurture mid-tier customers with targeted recommendations that encourage repeat purchases.
-
Reduce cart abandonment with strategic interventions. Send automated emails to cart abandoners within one hour, offering help or a small incentive to complete checkout. Test different subject lines and offers to find what converts best. Even recovering 10% of abandoned carts significantly impacts monthly revenue.
-
Monitor return rates by product category. If athletic shoes return at 25% but accessories at 5%, investigate why. Perhaps shoe sizing guides need improvement, or product photos don’t accurately represent colors. Fixing these issues protects profit margins.
Comparing different KPI-driven approaches reveals what works for your specific audience:
| Strategy | Primary KPI impact | Implementation complexity | Typical results |
|---|---|---|---|
| Cross-selling recommendations | Increases average order value | Medium | 10-20% AOV lift |
| Customer segmentation campaigns | Boosts customer lifetime value | High | 15-30% repeat purchase increase |
| Cart abandonment emails | Reduces abandonment rate | Low | 5-15% cart recovery |
| Mobile checkout optimization | Improves conversion rate | Medium | 20-40% mobile conversion gain |
The key to success lies in continuous monitoring and iteration. Tracking the right ecommerce KPIs is crucial for optimizing sales strategies and improving customer retention, but only if you act on what the data reveals. Set monthly goals for each core KPI, implement targeted improvements, and measure results.
Customer retention particularly benefits from KPI-focused strategies. When you track repeat purchase rates and customer lifetime value, you spot declining engagement early. A customer who bought three times in their first six months but hasn’t ordered in 90 days needs a win-back campaign. Automated systems can trigger these interventions based on behavioral KPIs, keeping customers active without manual effort.
For deeper insights into turning data into growth, learn how to analyze ecommerce sales data growth and master ecommerce analytics terminology to communicate effectively with your team. The more fluent you become in KPI analysis, the faster you’ll spot opportunities and threats.
Optimize your ecommerce growth with Affinsy
Understanding KPIs is one thing. Having the right tools to track, analyze, and act on them is another entirely. Affinsy transforms your historical transaction data into actionable insights that drive measurable growth.

Our AI-powered platform automatically identifies hidden product associations and customer patterns your competitors miss. You’ll discover which products sell best together, which customer segments deliver the highest lifetime value, and where your retention strategies need reinforcement. Features like market basket analysis and RFM segmentation turn complex data science into simple dashboards any manager can use.
Affinsy integrates seamlessly with Shopify, WooCommerce, and Google Analytics, pulling your data into one unified view. No more jumping between platforms or wrestling with spreadsheets. Custom reports, advanced dashboards, and automated alerts keep you focused on what matters: growing sales and keeping customers coming back. Leverage predictive analytics to forecast trends, apply customer segmentation to personalize marketing, and deploy smart product recommendations that increase average order value. When you’re ready to move from tracking KPIs to transforming them into revenue, Affinsy provides the intelligence you need.
Frequently asked questions
What are the most important ecommerce KPIs to monitor?
Focus on conversion rate, average order value, customer lifetime value, cart abandonment rate, and return rate. These five metrics provide comprehensive insight into sales efficiency, customer behavior, and operational health. They cover the entire customer journey from first visit through repeat purchases, revealing both immediate issues and long-term trends.
How often should I review ecommerce KPIs?
Review critical KPIs weekly for fast-moving campaigns and promotional periods. Conduct monthly deep dives to spot trends and adjust strategies. Quarterly reviews should inform major decisions like budget allocation and product line changes. High-volume stores may need daily monitoring during peak seasons, while smaller operations can maintain monthly rhythms.
Can ecommerce KPIs help improve customer retention?
Absolutely. KPIs like customer lifetime value, repeat purchase rate, and time between orders directly measure retention health. When these metrics decline, you know engagement is slipping and can trigger win-back campaigns. Analyzing purchase patterns by customer segment enables personalized marketing that keeps high-value customers active and loyal.
What’s a good conversion rate for ecommerce stores?
Average ecommerce conversion rates hover around 2-3%, but this varies dramatically by industry and traffic source. Fashion might see 1-2% while specialty B2B products hit 5-8%. Focus less on industry benchmarks and more on your own trends. A conversion rate improving from 2.1% to 2.4% represents significant revenue growth regardless of what competitors achieve.
How do I calculate customer lifetime value accurately?
Multiply average purchase value by purchase frequency, then multiply that result by average customer lifespan in years. For example, if customers spend $75 per order, buy four times yearly, and stay active for three years, their lifetime value is $900. Track this metric by acquisition channel to identify which marketing sources deliver the most valuable long-term customers.
Recommended
- Ecommerce Success Metrics: Driving Revenue Growth - Affinsy Blog | Affinsy
- Marketing analytics trends 2026: optimize ecommerce sales - Affinsy Blog | Affinsy
- Ecommerce Analytics Trends 2026: Unlocking Growth Through AI - Affinsy Blog | Affinsy
- E-commerce optimization checklist for AI-powered growth 2026 - Affinsy Blog | Affinsy
- Ecommerce in Apparel: Driving Global Fashion Trends – Smoked Times