
TL;DR:
- A multi-channel sales analysis workflow consolidates and examines sales data from all channels to improve margins and customer retention. Its success depends on clean, normalized data, a clear business question, and a fixed review cadence, not just technology. Tracking Contribution Margin 3 ensures accurate profitability insights, leading to better investment decisions and stronger growth.
A multi-channel sales analysis workflow is the structured process of consolidating and examining sales data from every channel you sell through, then turning that combined view into decisions that improve margin and customer retention. Without it, you are making channel investment calls based on incomplete numbers. Top-quartile organizations with mature multi-channel journey analytics achieve 5.7x marketing ROI compared to 1.8x for lower quartiles. That gap is not a technology advantage. It is a workflow advantage. This guide walks business analysts and e-commerce professionals through the prerequisites, the step-by-step setup, the common mistakes, and the tools that make a data-driven sales workflow repeatable and profitable.
What prerequisites does a multi-channel sales analysis workflow require?
Building a reliable workflow starts with knowing exactly what data you need and where it lives. Missing even one source creates blind spots that distort every downstream calculation.
Core data sources to gather first:
- CRM data: Contact records, deal stages, and closed-won revenue by source
- Marketplace order exports: Amazon, eBay, Etsy, or any platform where you list products
- Ad platform reports: Spend, impressions, clicks, and conversions from Google Ads, Meta, and TikTok
- Point-of-sale records: In-store or pop-up transaction logs if you sell offline
- Inventory and fulfillment data: Cost of goods sold, return rates, and shipping costs per channel
- Subscription or SaaS billing data: Stripe exports or equivalent if you sell recurring products
Each source arrives in a different format. A Shopify CSV uses different column names than a Meta Ads report. Automated normalization of fragmented marketplace data using structured schemas is the technical step that makes aggregation accurate. Without it, you are adding apples to oranges and calling it fruit salad.
Marketing attribution deserves its own line item in your prerequisites checklist. Attribution errors distort channel-level customer acquisition cost and profitability insights before you even begin analysis. Resolve your attribution model first, whether that is last-click, first-click, or data-driven, and document it so every analyst on your team uses the same logic.

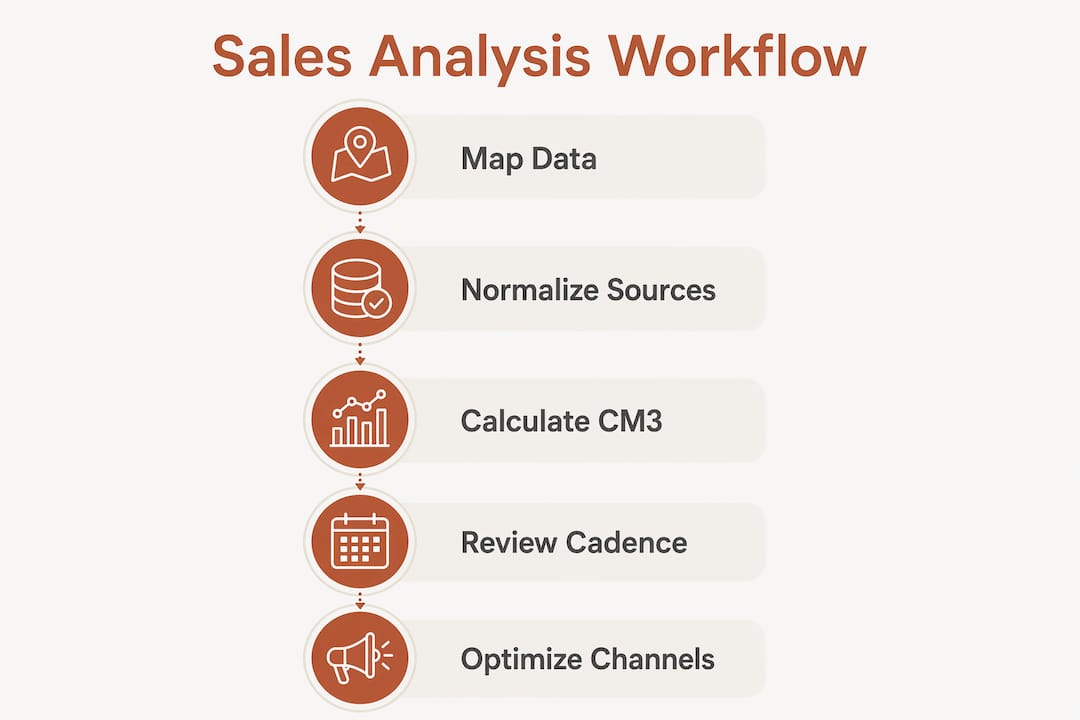
Pro Tip: Before you pull a single report, map every data source to a single unified schema with consistent field names: channel, order ID, revenue, cost of goods, ad spend, and date. This one-time setup saves hours of cleanup on every future analysis cycle.
Human resources matter as much as technical ones. You need at least one analyst who understands SQL or a BI tool like Looker or Tableau, a finance stakeholder who owns cost accounting, and a marketing lead who can explain attribution decisions. A workflow without those three roles breaks down at the interpretation stage.
How to set up a step-by-step multi-channel sales analysis workflow
A clear sequence prevents the most common failure mode: pulling data before you know what question you are trying to answer.
-
Define a specific business question. “Which channel generates the highest net margin per order?” is a question. “How are sales doing?” is not. Your question determines which data you pull and which metrics you calculate.
-
Build a unified data view. Combine your normalized channel exports into a single table or dashboard. Every row should represent one order, with columns for channel, gross revenue, cost of goods sold, ad spend attributed to that order, fulfillment cost, and return cost.
-
Calculate Contribution Margin 3 (CM3). Gross revenue minus cost of goods, minus variable fulfillment costs, minus attributed marketing spend gives you CM3. Transitioning reporting to CM3 reveals channels with up to 22% higher net margin per unit compared to gross revenue reporting. That difference changes which channels you scale.
-
Run a channel mix analysis. Compare CM3 per order across every channel. Identify which channels are profitable at current volume and which require volume increases to break even on fixed costs.
-
Add anomaly detection. Set threshold alerts for week-over-week revenue drops greater than 15% or return rate spikes above your baseline. Unified streaming SQL enables real-time multi-channel order analytics with materialized views for channel breakdown and anomaly detection. Real-time alerts let you act before a bad week becomes a bad month.
-
Establish a fixed review cadence. Weekly pipeline reviews and monthly revenue-by-segment checks tied to specific business questions prevent data overload and keep analysis focused on decisions. Schedule these reviews as recurring calendar blocks, not optional check-ins.
Pro Tip: Use SQL window functions to calculate rolling 4-week averages for each channel. Comparing current week performance against a rolling average catches seasonal noise and surfaces genuine trend shifts.
The table below shows how a typical review cadence maps to specific analysis types and outputs.
| Review frequency | Analysis type | Output |
|---|---|---|
| Weekly | Pipeline and anomaly review | Flag underperforming channels, escalate issues |
| Monthly | Revenue by segment and channel CM3 | Reallocate ad spend toward higher-margin channels |
| Quarterly | Customer journey and attribution audit | Update attribution model, revise channel mix targets |
| Annually | Full cost allocation and overhead review | Recalibrate fixed cost assignments per channel |
Customer journey analysis differs from journey mapping. Journey mapping is a visualization. Journey analysis quantitatively measures conversion rates and time between stages to identify revenue bottlenecks. Your quarterly audit should include both the visual map and the economic measurement.
What common mistakes should you avoid in multi-channel sales analysis?
Most analysis errors fall into a small number of repeatable patterns. Knowing them in advance is faster than discovering them after a bad investment decision.
-
Reporting on gross revenue alone. Gross revenue hides channel profitability. A channel generating $500,000 in revenue at a 4% CM3 is less valuable than one generating $200,000 at a 28% CM3. Always report margin alongside revenue.
-
Skipping attribution resolution. Blended customer acquisition cost underestimates direct-to-consumer acquisition costs and overstates organic channel returns. Fix your attribution model before you interpret any channel performance number.
-
Using blended averages. Blended average metrics hide the true cost-to-serve per channel. A blended CAC of $18 across five channels might mask one channel with a $60 CAC that is dragging down your overall economics.
-
Accepting dirty data. Inconsistent product naming, duplicate order IDs, and missing cost fields corrupt every calculation downstream. Normalization is not optional.
-
Running ad-hoc analysis. Institutionalizing fixed weekly and monthly review cadences correlates with consistently higher business performance. Sporadic analysis produces sporadic results.
-
Ignoring overhead allocation. Warehouse costs, customer service headcount, and platform fees belong in your channel profitability model. Leaving them out makes every channel look more profitable than it is.
Failure to resolve marketing attribution before performance analysis leads to systematic skewing of channel economics. A channel that appears profitable under last-click attribution may be deeply unprofitable under a data-driven model. Audit your attribution logic before you act on any channel-level insight.
An omnichannel sales strategy that unifies customer experience across channels also requires unified data. You cannot deliver a consistent customer experience if your analytics team is working from five separate spreadsheets.
Which tools and technologies can optimize multi-channel sales analysis?
The right architecture reduces the manual work in your workflow and makes it possible to add new channels without rebuilding your entire pipeline.
Streaming SQL and materialized views are the most efficient architecture for real-time multi-channel analytics. A unified event schema captures every order event from every channel in a single stream. Materialized views then pre-aggregate that data into channel breakdowns, so your dashboard queries run in milliseconds instead of minutes. This approach also supports anomaly detection at the event level, catching problems the moment they appear rather than at the next scheduled report.
Config-driven overhead allocation frameworks solve the blended average problem at scale. Instead of manually splitting warehouse costs across channels each month, a configurable framework applies your allocation rules automatically as new orders arrive. This preserves accurate channel profitability as your business grows and as you add new channels.
BI tools with scheduled refresh handle the reporting layer. Looker, Tableau, and Power BI all support scheduled data refreshes and threshold-based alerts. The key is connecting them to your unified data layer rather than to individual channel exports. Connecting directly to exports means your reports go out of sync the moment one channel changes its export format.
Pro Tip: Build your unified schema around order events, not channel reports. An event-based schema captures every touchpoint in the customer journey and makes it far easier to run path analysis and funnel analysis later without restructuring your data model.
Mature multi-channel analytics include path analysis, funnel analysis, attribution analysis, and predictive intelligence like churn forecasting. These four capabilities move beyond traffic tracking into revenue management. Start with path and funnel analysis in your first quarter, then layer in attribution auditing and churn prediction as your data quality improves.
Affinsy connects to any transactional data source via API, CSV upload, or MCP. That means you can feed your unified order export directly into Affinsy’s market basket analysis and RFM segmentation without building a custom integration. For teams that already export data from Shopify, WooCommerce, or Stripe, the path from raw data to cross-selling insights is a single file upload.
A multichannel SEO strategy that drives traffic from multiple sources also generates the multi-channel data your workflow depends on. More channels mean more data, and more data means more accurate segmentation and attribution.
Key Takeaways
A disciplined multi-channel sales analysis workflow built on CM3 margin metrics, clean data, and a fixed review cadence consistently outperforms ad-hoc reporting in both profitability and decision speed.
| Point | Details |
|---|---|
| CM3 over gross revenue | Report Contribution Margin 3 per channel to reveal true profitability, not just top-line performance. |
| Fix attribution first | Resolve your attribution model before interpreting any channel-level cost or profitability metric. |
| Normalize data early | Apply a unified event schema to all channel exports before aggregation to prevent downstream errors. |
| Fixed cadence beats ad-hoc | Weekly pipeline reviews and monthly segment checks produce better outcomes than irregular analysis. |
| Config-driven allocation | Use configurable overhead allocation frameworks to maintain accurate channel profit as you scale. |
Why margin discipline is the real differentiator in multi-channel analysis
I have worked with e-commerce teams that ran detailed channel reports every week and still made poor investment decisions. The reports were thorough. The problem was that every metric pointed to gross revenue. A channel generating strong top-line numbers got more budget. A channel with modest revenue but exceptional margin got cut. The business grew in volume and shrank in profit.
The shift that changed outcomes was not a new tool. It was a decision to report CM3 as the primary metric and treat gross revenue as context. That single change forced every channel conversation to include cost of goods, fulfillment, and attributed ad spend. Channels that looked like winners under gross revenue reporting often looked very different under CM3. Reallocation of even 20% of ad spend toward higher-margin channels produced measurable profit improvement within two quarters.
The second thing I have seen consistently is that cadence matters more than sophistication. Teams with a weekly 30-minute pipeline review and a monthly segment check outperform teams with elaborate dashboards that nobody opens on a schedule. The habit of looking at the same metrics on the same day every week builds the institutional memory that makes anomalies visible. You cannot spot a trend if you only look when something feels wrong.
Technology is a multiplier, not a foundation. Streaming SQL, materialized views, and AI-powered segmentation tools like Affinsy accelerate analysis that is already well-structured. They do not fix a workflow that lacks clear questions, clean data, or a fixed cadence. Get the discipline right first. Then let the tools make it faster.
— Mateusz
How Affinsy supports your channel analytics workflow
Building a multi-channel sales analysis workflow generates the transaction data that Affinsy is designed to analyze. Once your order exports are clean and unified, Affinsy’s market basket analysis surfaces product association patterns across channels, showing which items customers buy together and where cross-sell opportunities exist by channel. Its RFM customer segmentation then groups buyers by recency, frequency, and monetary value so you can target retention campaigns at the segments most likely to churn.
Affinsy connects via API, CSV upload, or MCP, so any team already exporting order data from Shopify, WooCommerce, BigCommerce, or Stripe can start analysis without a custom integration. The permanent free tier covers up to 20,000 line items with full product access and no credit card required. Pro plans start at $49/month for larger datasets.
FAQ
What is a multi-channel sales analysis workflow?
A multi-channel sales analysis workflow is a structured process for consolidating sales data from every channel, normalizing it into a unified view, and analyzing it on a fixed cadence to drive margin and retention decisions.
How do you analyze sales data across multiple channels?
Export order data from each channel, normalize it to a shared schema with consistent fields like channel, revenue, cost, and ad spend, then calculate Contribution Margin 3 per channel to compare true profitability.
What is Contribution Margin 3 (CM3) in channel analysis?
CM3 is gross revenue minus cost of goods sold, variable fulfillment costs, and attributed marketing spend. Reporting on CM3 reveals channels with up to 22% higher net margin per unit than gross revenue reporting shows.
Why does marketing attribution matter before analyzing channel performance?
Attribution errors distort customer acquisition cost and profitability at the channel level. Blended CAC underestimates direct-to-consumer costs and overstates organic returns, leading to misallocated ad spend.
How often should you review multi-channel sales data?
Weekly pipeline reviews and monthly revenue-by-segment checks tied to specific business questions produce the best outcomes. Fixed cadence reviews consistently outperform ad-hoc analysis in both accuracy and decision quality.
Recommended
- Cross Selling Strategies Guide to Boost Online Store Revenue - Affinsy Blog | Affinsy
- Sales Analysis Guide: Strategies and Best Practices for 2025 - Affinsy Blog | Affinsy
- Sales Analysis Example Guide for Beginners (2025) - Affinsy Blog | Affinsy
- 7 Essential Sales Analysis Report Insights for 2025 - Affinsy Blog | Affinsy