
Average order value (AOV) is the single most underused lever in e-commerce. While most store owners chase new traffic, the faster path to more revenue is already sitting in your checkout data. AOV measures how much a customer spends per transaction, and raising it costs far less than acquiring a new customer.
Table of Contents
- What is average order value and why does it matter?
- How to calculate average order value accurately
- How does your AOV compare to industry benchmarks?
- 7 proven strategies to increase average order value
- How AOV fits with your other key metrics
- How AI-powered analytics can sharpen your AOV strategy
- Common mistakes when calculating or interpreting AOV
- Why segmenting AOV by customer behavior reveals more than the average
- Real-world examples of AOV improvement in practice
- How seasonality and promotions shift your average transaction value
- Tools and software to track and analyze AOV
- Key Takeaways
What is average order value and why does it matter?
AOV is the average dollar amount customers spend each time they place an order. The formula is straightforward: divide total revenue by total number of orders in a given period. If your store generated $50,000 from 1,000 orders last month, your AOV is $50.
What makes AOV worth tracking is its direct connection to revenue without touching acquisition costs. A higher AOV means more money from the same number of transactions. That math compounds fast when you’re running paid ads or investing in retention.
AOV also differs from average revenue per customer. AOV measures a single transaction; average revenue per customer captures everything a buyer spends across their entire relationship with your store. Both matter, but they answer different questions.
Key benefits of tracking AOV:
- Reveals whether pricing and bundling strategies are working
- Helps set free shipping thresholds that actually improve margins
- Guides decisions about upsell and cross-sell placement
- Flags when promotions are pulling order sizes down
- Provides a baseline for testing new product packages
| Metric | What it measures | Why it matters |
|---|---|---|
| Average order value | Spend per transaction | Directly tied to revenue per visit |
| Average revenue per customer | Lifetime spend per buyer | Indicates loyalty and retention health |
| Conversion rate | % of visitors who buy | Context for interpreting AOV changes |
How to calculate average order value accurately
The AOV formula is: Total Revenue ÷ Total Number of Orders = AOV. Revenue here means product sales plus shipping, but not taxes. That distinction matters more than it sounds.
Example: In June, your store brought in $5,200 across 236 orders. AOV = $5,200 ÷ 236 = $22.03.
Consistency in your revenue definition is what keeps month-over-month comparisons meaningful. If you include shipping one month and exclude it the next, your trend data becomes noise. Document your definition internally and stick to it. Rounding discrepancies can also creep in at high order volumes, so use the same calculation method every time.
One refinement worth knowing: the modal order value, the most common single order amount, often tells you more than the mean when you’re setting incentive thresholds. If your mean AOV is $55 but most orders cluster around $35, build your free shipping trigger around $45, not $72.
Pro Tip: Track AOV monthly or quarterly rather than daily. Daily figures swing too much to be useful for strategy. Monthly gives you enough data to spot real trends without the noise.
| Time period | Orders | Revenue | AOV |
|---|---|---|---|
| January | — | — | $50 |
| February | — | — | — |
| March | — | — | $50 |
How does your AOV compare to industry benchmarks?
The global average AOV across all e-commerce industries sits around $145, but that number alone tells you almost nothing. Industry context is everything.
| Industry | Typical AOV range |
|---|---|
| Luxury and jewelry | frequently above $300 |
| Apparel and accessories | $40-$170 |
| Beauty and personal care | $15-$90 |
| Home and garden | mid-range values |
| Electronics | variable, often above average |
A beauty brand with a moderately high AOV is performing well. An apparel store at similar values may have room for improvement. Use benchmarks to set realistic targets, not to declare victory or panic.
Benchmarks also vary by business model, traffic source, and customer mix. A store running heavy discount promotions will see a structurally lower AOV than one selling at full price. That gap reflects strategy, not just performance.
7 proven strategies to increase average order value
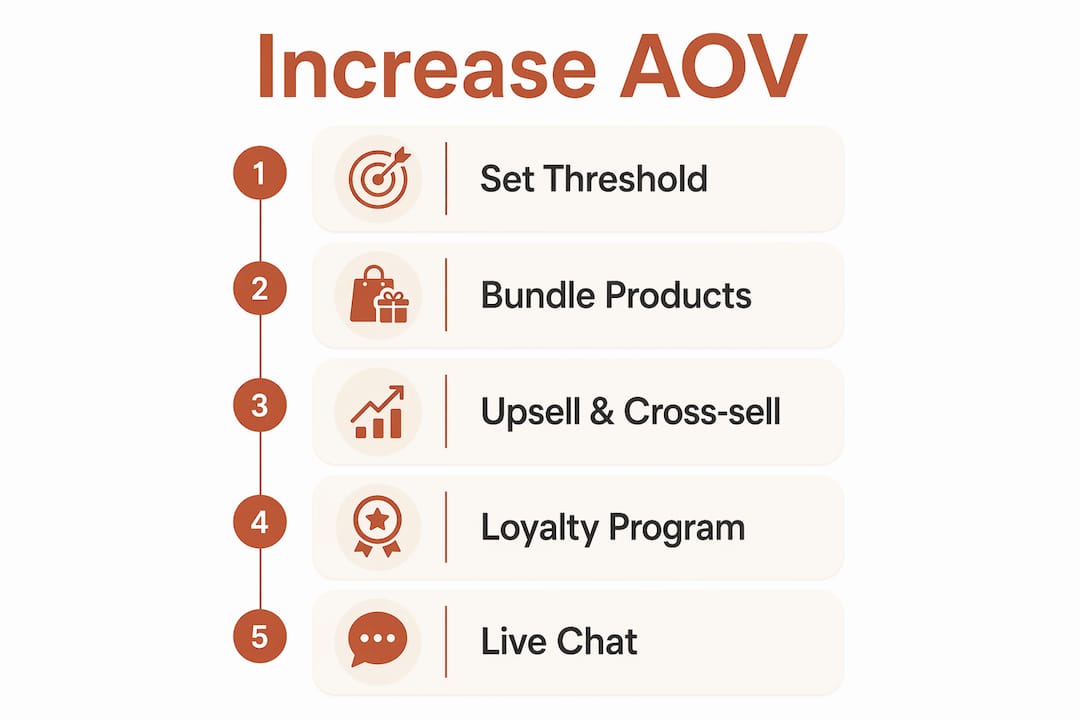
1. Set a free shipping threshold above your current AOV
Free shipping is still one of the most effective nudges in e-commerce. The key is placing the threshold moderately above your current AOV, or better yet, above your modal order value, to encourage larger purchases without cart abandonment. If most orders land around $35, a $50 free shipping trigger feels attainable rather than frustrating. Set it too high and you get abandoned carts instead of bigger baskets.
2. Bundle products into packages
Product bundles let customers feel like they’re getting a deal while you move more inventory per transaction. A skincare brand that sells cleanser, toner, and moisturizer separately can bundle all three at a slight discount and watch average basket size climb. The bundle price should still protect your margins, so run the numbers before publishing.
3. Upsell and cross-sell at the right moment
Upselling means offering a better version of what the customer is already buying. Cross-selling means suggesting something complementary. Both work best when the recommendation is genuinely relevant. A customer buying a camera doesn’t need a random accessory; they need a memory card or a bag. Placement matters too: product pages and the cart are the highest-converting spots.

4. Launch a customer loyalty program
Loyalty programs push customers to spend more per order to reach reward thresholds. For stores selling consumables like coffee, supplements, or skincare, a points program creates a reason to consolidate purchases rather than split them across multiple smaller orders. The program also builds retention, which compounds the AOV benefit over time.
5. Use live chat to remove purchase hesitation
A customer sitting on a $120 order with a question about sizing or compatibility will often abandon rather than search for answers. Live chat catches that moment. Resolving a doubt in real time frequently converts a hesitant buyer into a confident one who adds another item before checking out.
6. Deploy AI-powered product recommendations
Personalized recommendations powered by AI analyze browsing history, past purchases, and current cart contents to surface the items a shopper is most likely to add. Companies using highly personalized interactions often see significantly higher conversion and revenue increases compared to less personalized approaches. Generic “customers also bought” carousels underperform because they ignore individual context. AI-driven suggestions don’t.
7. Add post-purchase upsells
Post-purchase upsells appear after the order is confirmed, so they carry zero risk of disrupting the original conversion. The customer has already committed. A well-timed offer for a related product or a subscription upgrade at that moment often converts at rates that surprise store owners who’ve never tested it. Start with one relevant offer and measure the attach rate before adding more.
Pro Tip: Before launching any threshold or discount, simulate the contribution margin impact. A free shipping offer that adds $15 to AOV but costs $12 in shipping is a net loss. Model the numbers first.
How AOV fits with your other key metrics
AOV doesn’t live in isolation. Tracking it alongside conversion rate is critical because raising prices to lift AOV can suppress conversions, and the net effect on revenue may be negative. Always verify that an AOV increase actually improves total revenue, not just the per-order number.
Metrics to watch alongside AOV:
- Conversion rate: A rising AOV paired with falling conversions is a warning sign, not a win.
- Cart abandonment rate: With an average cart abandonment rate of around 70%, friction at checkout can undermine even strong order values.
- Customer lifetime value: AOV feeds into lifetime value calculations; a higher AOV compounds significantly for repeat buyers.
- Return rate: A spike in AOV driven by expensive items can mask a rising return rate that erodes actual revenue.
How AI-powered analytics can sharpen your AOV strategy
The most durable AOV gains come from understanding why customers spend what they spend, not just nudging them with thresholds and bundles. That’s where AI analytics changes the picture.
Segmenting AOV by customer cohort and traffic source reveals whether your growth is sustainable or just a promotion spike. A high AOV from cold traffic often signals a short-term discount effect, not genuine purchase intent. Sustainable AOV growth shows up in repeat buyer cohorts first.
Affinsy’s market basket analysis surfaces product association patterns that aren’t obvious from looking at top sellers alone. You might discover that customers who buy product A and product C in the same order spend 40% more on average, which tells you exactly which bundle to build next. That kind of insight used to require a data scientist. Affinsy makes it available to store owners and marketing managers working from a CSV export.
The platform’s RFM customer segmentation also lets you break AOV down by buyer behavior: first-time buyers, high-frequency repeat customers, and lapsed customers all have different average transaction values and respond to different incentives. Treating them identically wastes budget and dilutes results.
Pro Tip: Before deploying a new free shipping threshold, use Affinsy’s analytics to simulate the contribution margin impact across your actual order distribution. A threshold that looks good on average can hurt margins in your highest-volume price band.
Common mistakes when calculating or interpreting AOV
The most frequent error is inconsistency in the revenue definition. Some teams include taxes; others don’t. Some count refunded orders; others strip them out. None of those choices is wrong, but switching between them mid-analysis produces meaningless trend data. Pick a definition, document it, and enforce it across every report.
A second mistake is treating a rising AOV as automatically good news. If AOV climbs because you ran a sitewide promotion that attracted bulk buyers who never return, you’ve bought a metric at the cost of margin. Context always matters more than the number itself.
Finally, many store owners calculate AOV across all orders without segmenting. A single blended number hides the fact that mobile shoppers, first-time buyers, and email subscribers may have dramatically different spending patterns, each requiring a different response.
Why segmenting AOV by customer behavior reveals more than the average
A blended AOV is a starting point, not a strategy. Splitting it by customer type and traffic source shows you where growth is actually coming from. Segmenting AOV by cohort reveals whether your high spenders are loyal repeat buyers or one-time deal hunters responding to a discount.
First-time buyers typically have a lower AOV than repeat customers because they’re testing your store. If your new-buyer AOV is rising, your onboarding and product discovery are working. If repeat-buyer AOV is flat, your loyalty and upsell programs need attention.
Traffic source segmentation is equally revealing. Organic search visitors often browse more broadly and add more items. Paid social traffic tends to arrive with a specific product in mind and checks out with less. Knowing that lets you tailor the upsell experience by channel rather than showing everyone the same recommendations.
Real-world examples of AOV improvement in practice
A home goods retailer noticed its AOV had plateaued around $65 despite steady traffic growth. After running a market basket analysis, the team found that customers who bought throw pillows rarely added blankets in the same order, even though the two products were frequently purchased by the same customers across separate visits. A simple bundle offer combining both at a 10% discount pushed AOV to $82 within 60 days, without touching ad spend.
An apparel brand tested a free shipping threshold at $75, up from $50. The first two weeks showed a 12% AOV lift. But when the team modeled contribution margin, shipping costs on the newly qualifying orders nearly offset the revenue gain. They adjusted the threshold to $85 and retained most of the AOV lift while restoring margin. The lesson: test, then model the full economics before scaling.
These examples follow the same pattern. The insight comes from the data, the fix is usually simple, and the margin impact only becomes clear when you run the numbers rather than just watching the AOV line go up.
How seasonality and promotions shift your average transaction value
AOV is not a flat number across the year. Holiday seasons, back-to-school periods, and major sale events all move it, sometimes in opposite directions. During the holiday season, gift buyers tend to spend more per order because they’re purchasing for multiple recipients. That inflates AOV in November and December in ways that don’t reflect your baseline business health.

Promotions create the opposite effect. A sitewide 20% discount typically pulls in price-sensitive buyers who purchase fewer items at lower prices. AOV drops, conversion rises, and whether that trade is profitable depends entirely on your margins. Tracking AOV before, during, and after a promotion gives you the full picture.
The practical move is to maintain a seasonally adjusted AOV baseline. Compare November to the prior November, not to October. That comparison tells you whether your holiday strategy is improving year over year, which is the question that actually matters for planning.
Tools and software to track and analyze AOV
Every major e-commerce platform calculates AOV natively. Shopify, WooCommerce, and BigCommerce all surface it in their analytics dashboards, updated in near real time. For most stores, that’s the right place to start.
Google Analytics 4 tracks AOV as part of its e-commerce reporting, and it adds the ability to segment by traffic source, device, and geography without any additional setup. That segmentation is where the platform earns its place in an AOV workflow.
For deeper analysis, including product association patterns, customer cohort breakdowns, and margin simulation, Affinsy connects to any platform via CSV upload or API. You export your order data from Shopify, WooCommerce, BigCommerce, Stripe, or any system that produces transactional records, then feed it into Affinsy. The platform’s step-by-step AOV analysis tools surface bundle opportunities and customer segments that standard dashboards don’t show. The free tier covers up to 20,000 line items with no credit card required, which is enough for most mid-sized stores to run a meaningful first analysis.
For in-store and retail contexts, physical display and upsell placement also drive order value, following many of the same principles as digital cross-selling.
Key Takeaways
Raising average order value is the most cost-effective path to revenue growth because it works on customers who are already buying from you.
| Point | Details |
|---|---|
| AOV formula | Divide total revenue (including shipping, excluding taxes) by total number of orders. |
| Global benchmark | The global average AOV across all industries is approximately $145; your target depends on your vertical. |
| Segmentation matters | Split AOV by customer cohort and traffic source to distinguish sustainable growth from promotion spikes. |
| Margin simulation first | Always model contribution margin impact before deploying free shipping thresholds or discounts. |
| AI analytics accelerate gains | Tools like Affinsy surface bundle and cross-sell opportunities from transaction data without requiring data science skills. |
Recommended
- Increasing Average Order Value Steps: Boost Sales Effectively - Affinsy Blog | Affinsy
- Why Optimize Average Order Value for E-Commerce Growth - Affinsy Blog | Affinsy
- Average Order Value (AOV) — E-Commerce Glossary | Affinsy | Affinsy
- How to Maximize Average Order Value for E-Commerce Stores - Affinsy Blog | Affinsy