
TL;DR:
- Purchase pattern analysis helps identify top revenue-generating customers and their buying behaviors.
- Combining Market Basket Analysis with RFM segmentation enables targeted cross-sell, upsell, and retention strategies.
- Advanced techniques like sequence analysis and AI clustering improve prediction accuracy and business outcomes.
Most e-commerce teams assume their customer base is a broad, relatively even mix of buyers. In reality, 20% of customers generate 60-80% of revenue, and the fastest-growing brands know exactly who those customers are, what they buy next, and when they’re about to churn. Purchase pattern analysis is what separates that knowledge from guesswork. This guide breaks down the frameworks, methods, and practical steps marketing professionals at mid-to-large retailers need to turn raw transaction data into sharper segments and stronger sales strategies.
Table of Contents
- What is purchase pattern analysis?
- Market Basket Analysis vs. RFM: Core methods explained
- Advanced analysis: AI, sequencing, and improved accuracy
- Applying insights: Driving segmentation and sales impact
- A fresh perspective: What most people miss about purchase pattern analysis
- Take the next step with Affinsy
- Frequently asked questions
Key Takeaways
| Point | Details |
|---|---|
| Small segments drive big revenue | A small group of customers—5-10 percent—often account for the majority of e-commerce sales. |
| MBA and RFM are core tools | Market Basket Analysis and RFM analysis form the foundation for impactful purchase pattern analysis. |
| AI and ML boost results | Advanced machine learning techniques can enhance accuracy and drive higher customer lifetime value. |
| Action beats analysis | Applying segment insights through tailored campaigns is critical to lifting sales and loyalty. |
| Validate insights regularly | You should recalculate segments and validate associations monthly to ensure ongoing accuracy and effectiveness. |
What is purchase pattern analysis?
Purchase pattern analysis is the systematic process of examining historical transaction data to understand how and what customers buy, when they buy it, and how those behaviors cluster into meaningful groups. The core goal isn’t just reporting on what happened. It’s surfacing the hidden structure in your order data so you can act on it with precision, whether that means personalizing email campaigns, restructuring product bundles, or identifying your highest-risk churners before they go silent.
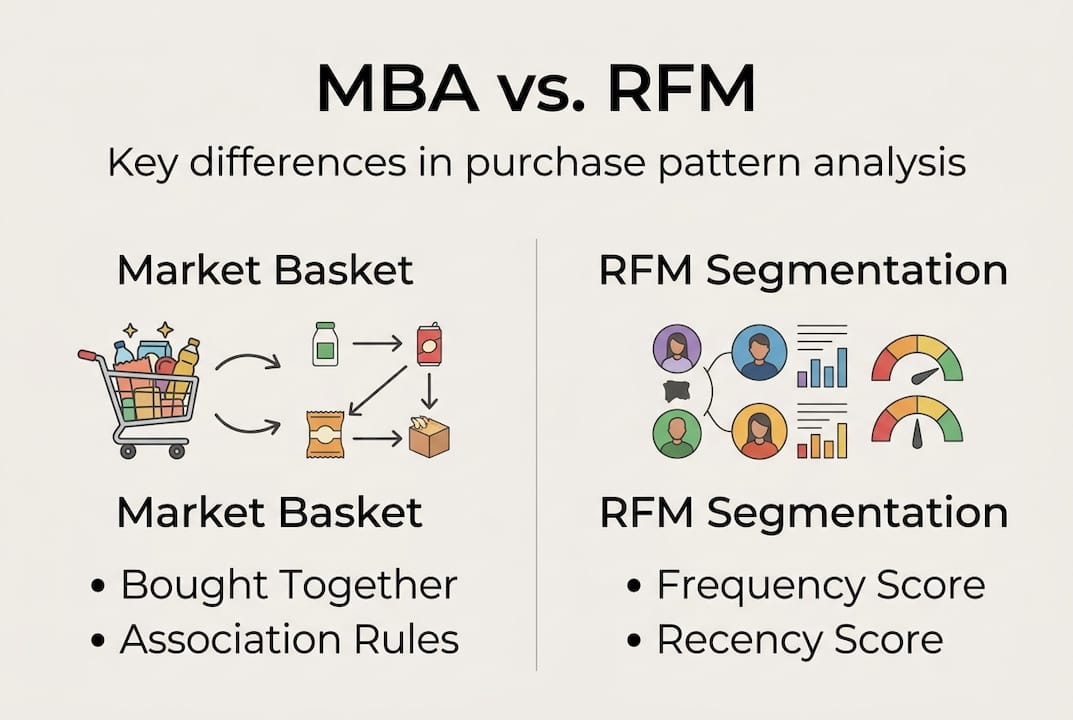
The two foundational approaches you’ll encounter are Market Basket Analysis (MBA) and RFM analysis. MBA uncovers product associations, specifically which items tend to be purchased together. RFM classifies customers based on three behavioral signals: how recently they bought (Recency), how often they buy (Frequency), and how much they spend (Monetary value). These aren’t competing methods. They answer different questions and work best together.
A few terms you’ll need to know before diving into the mechanics:
- Association rules describe relationships between products, often written as “X → Y,” meaning customers who buy X also tend to buy Y.
- Support measures how frequently an itemset appears across all transactions.
- Confidence is the probability that a customer who buys X will also buy Y.
- Lift measures how much more likely the association is compared to random chance. A lift above 1.0 means the relationship is real, not coincidental.
- Recency, Frequency, Monetary (RFM) are the three scoring dimensions used to rank and segment customers by behavior.
“The best segmentation systems don’t just describe who your customers are. They predict what those customers will do next.”
Understanding these building blocks positions you to boost sales with pattern analysis in ways that are grounded in evidence rather than intuition. Let’s see exactly how these two methods operate in practice.
Market Basket Analysis vs. RFM: Core methods explained
MBA and RFM are built for different jobs, and confusing them is one of the most common mistakes e-commerce marketing teams make. Here’s how each works and where each one shines.
Market Basket Analysis in practice
MBA uses the Apriori algorithm to scan transaction logs, identify frequently purchased itemsets, and generate association rules with support, confidence, and lift scores. Think of it like a sophisticated “customers also bought” engine, except instead of a simple recommendation module, it gives you statistically validated rules you can apply across your email sequences, checkout upsells, and category page layouts.
Running MBA in four steps:
- Export your order line item data (product ID, order ID, customer ID, date).
- Set minimum support and confidence thresholds appropriate for your catalog size.
- Run the Apriori algorithm (or an FP-Growth variant for larger datasets) to generate candidate rules.
- Filter by lift greater than 1.2 to keep only rules that reflect genuine, non-random associations.
RFM segmentation in practice
RFM scores each customer on a scale (often 1 to 5) for each of the three dimensions. A customer who bought last week, buys monthly, and spends above average earns a high composite score and falls into the “Champions” segment. A customer who bought once eighteen months ago, never returned, and spent below average lands in “Lost.” Champions typically represent 5-10% of your customer base, but disproportionate revenue follows them.
Running RFM in four steps:
- Pull order data with customer ID, order date, and order value.
- Calculate each customer’s most recent purchase date, total order count, and total spend.
- Assign quantile-based scores (1 to 5) for each dimension.
- Combine scores to assign segment labels: Champions, Loyal, At Risk, Lost, and so on.
| Feature | Market Basket Analysis | RFM Segmentation |
|---|---|---|
| Primary question | What gets bought together? | Who are your most valuable customers? |
| Data needed | Order line items (products) | Order-level data (dates, amounts) |
| Core metric | Lift, support, confidence | R, F, M scores |
| Best for | Cross-sell, bundle design, layout | Lifecycle campaigns, churn, LTV |
| Output | Association rules | Customer segment labels |
| Update frequency | Monthly or after catalog changes | Monthly minimum |
Pro Tip: Always filter your MBA results by lift, not just confidence. A high-confidence rule can still be misleading if the two products are so popular that customers would buy them together anyway. Lift corrects for that. For RFM, check a detailed MBA guide to see how combining both methods in a single workflow can sharpen your campaign targeting considerably.
The key insight here is that MBA tells you what to recommend; understanding RFM tells you who to recommend it to. Run them in parallel and you get both dimensions: the right product for the right customer at the right moment.
Advanced analysis: AI, sequencing, and improved accuracy
The core methods above get you a long way. But the brands pulling the biggest gains are layering in advanced techniques that go beyond static association rules and quarterly segment reviews. These tools used to require a full data science team. Today, they’re increasingly accessible to any e-commerce operation with clean transaction data and the right platform.
Sequence analysis
Sequence analysis identifies not just which products are bought together, but in what order and within what time window. For example, a customer who buys a fitness tracker often purchases a replacement band within 60 days, then protein supplements within 90 days. That timing pattern is invisible to standard MBA, but sequence and timing analysis surfaces it so you can trigger relevant offers at exactly the right moment.
Uplift modeling
Uplift modeling answers a different and more commercially useful question than traditional propensity scoring. Instead of asking “who is likely to buy?” it asks “who is more likely to buy because of this campaign?” This distinction matters enormously in practice. You avoid wasting budget on customers who would have bought anyway, and you focus spend on segments where your intervention actually changes behavior.
AI and machine learning clustering
Advanced methods like Bisecting K-Means applied to RFM data can uncover hidden customer groups that fixed segment labels miss. Traditional RFM gives you maybe 10-15 named segments. ML clustering can identify 30 or 40 distinct behavioral profiles, some of which are high-margin niches your current strategy doesn’t even address. And when AI is applied to pattern analysis broadly, the business results are measurable: AI-powered pattern analysis yields 12-25% accuracy improvements, 8-20% gains in customer lifetime value, and in documented e-commerce cases, a 22% reduction in cost per acquisition.

| Method | Primary goal | Typical tools | Expected gain |
|---|---|---|---|
| Sequence analysis | Predict purchase order and timing | Sequential pattern mining | Better triggered campaign timing |
| Uplift modeling | Identify who responds to offers | Causal ML models | Reduced wasted ad/email spend |
| ML clustering | Find hidden behavioral segments | K-Means, DBSCAN | 10-25% CLV improvement |
| AI association rules | Dynamic cross-sell at scale | Deep learning recommendation engines | 12-25% accuracy lift |
These methods aren’t reserved for companies with $10M+ analytics budgets. Platforms built specifically for e-commerce transaction analysis, including MBA beyond the cart use cases, now bring these capabilities within reach of any team that can export an order CSV. Explore sales pattern analysis strategies to see how mid-size brands are applying these techniques right now.
Pro Tip: Before scaling any advanced model into production, run an A/B test comparing lift metrics between your control group (standard logic) and your experimental group (ML-driven recommendations). Real incremental lift is the only signal that matters. Don’t let impressive model accuracy scores substitute for actual revenue evidence.
Applying insights: Driving segmentation and sales impact
Analysis without action is just a report. The teams that compound their returns from purchase pattern work are the ones that build automated, segment-specific workflows around their findings. Here’s what that looks like concretely for the segments that matter most.
Champions
These customers buy frequently, bought recently, and spend at the top of your range. The right moves here aren’t discounts. Discounting your best customers trains them to wait for promotions. Instead, give them early access to new products, exclusive bundles built around their known purchase associations, or a loyalty program tier with non-monetary rewards like free expedited shipping. MBA data tells you exactly which product combinations to build those bundles around.
At Risk customers
At Risk customers bought meaningfully in the past but haven’t returned in a concerning amount of time. Their average order value (AOV) is often the highest among all segments precisely because they were once highly engaged. A well-timed reactivation campaign with a strong association-based product recommendation (not just a generic “we miss you” email) can recover a significant portion of this group before they migrate fully to the Lost segment.
Lost customers
In one analyzed dataset, more than 50% of total revenue came from one-time buyers who never returned, classifying them as Lost. That’s not just a retention problem. It’s a massive recovery opportunity if you can re-engage even a fraction of them with the right offer.
Lost customers need a different playbook. Generic discounts rarely work here. The more effective approach combines MBA-sourced product recommendations with urgency signals. If their last purchase association suggests a natural follow-on product they never bought, lead with that. It’s relevant and specific, which is exactly what a dormant customer needs to re-engage.
Segment-specific actions to implement immediately:
- Champions: Early access launches, exclusive bundles, referral incentives
- Loyal: Cross-sell using MBA associations, upgrade prompts, anniversary rewards
- At Risk: Triggered reactivation with personalized top-seller recommendations, short-window offers
- Lost: Re-engagement sequences starting with the most relevant follow-on product from MBA data
- New customers: Onboarding flows that introduce high-affinity product pairs immediately, reducing time-to-second-purchase
A step-by-step MBA example shows how translating raw association rules into concrete campaign briefs looks in practice, with real product pairings and segment mapping that marketing teams can hand directly to their email or paid media teams.
A fresh perspective: What most people miss about purchase pattern analysis
Here’s where most e-commerce teams quietly go wrong, even after they’ve implemented RFM scoring and generated hundreds of association rules.
The first mistake is using revenue as the Monetary metric in RFM without checking whether those high-revenue customers are actually profitable. A customer who buys frequently but always during sales, returns items regularly, and requires extensive customer service might rank as a Champion on paper while actually dragging down contribution margin. Using contribution margin instead of raw revenue for the Monetary score, and normalizing Frequency by customer tenure rather than raw order count, gives you a far more accurate picture of who actually matters to your bottom line.
The second mistake is treating RFM as a one-time project. Segment composition shifts constantly. A customer who was At Risk in January might be a Champion by March if you ran a successful reactivation campaign. If you’re not recomputing scores monthly, your campaigns are targeting yesterday’s behavior. The tools for advanced pattern analysis that support automated monthly rescoring make this operationally trivial once the pipeline is set up.
The third and most consequential mistake is deploying association rules without validating them. High confidence alone is not proof of a meaningful relationship. A rule like “customers who buy shampoo also buy conditioner” might have a confidence of 85%, but if 90% of your customers buy conditioner anyway, the lift is below 1.0 and the rule is useless for targeting. Require lift above 1.2 at minimum and run an A/B test before building campaign infrastructure around any rule. This discipline alone separates teams that get real revenue lifts from teams that produce impressive-looking dashboards without changing actual outcomes.
Finally, consider hybrid models that combine MBA association rules with ranking signals like recency and segment tier. A product recommendation engine that surfaces high-lift associations only for Champions and Loyal customers, while serving different logic to At Risk and Lost segments, consistently outperforms a one-size-fits-all recommendation block. Build segment awareness into your recommendation logic from day one.
Take the next step with Affinsy
If you’ve worked through this guide and you’re ready to move from theory to execution, Affinsy is built for exactly this moment.

Affinsy is an AI-powered analytics platform that takes your existing order data, whether you export it from Shopify, WooCommerce, BigCommerce, Stripe, or any other platform, and surfaces MBA association rules and RFM segments without requiring a data science team. You can connect via API, CSV upload, or MCP. The permanent free tier supports up to 20,000 line items with full product access and no credit card required. If you’re running WooCommerce and want to get your data pipeline started immediately, the WooCommerce order exporter is a free tool to help you get clean, analysis-ready export files in minutes. Pro plans start at $49/month and Max at $199/month for larger datasets and API access.
Frequently asked questions
What types of data are needed for purchase pattern analysis?
You need order-level data that includes the products purchased, the purchase dates, and a customer identifier so individual behavior can be tracked across transactions over time.
How often should I recalculate RFM segments?
Monthly recalculation is the recommended standard to capture current customer behavior. Recomputing RFM monthly ensures your segments reflect recent purchases and don’t lock customers into stale classifications that distort your campaign targeting.
What is the difference between support, confidence, and lift in association analysis?
Support is how often two items appear together across all transactions; confidence is the probability of buying one item given the other was purchased; and lift measures strength beyond what random co-occurrence would predict, with values above 1.0 indicating a genuine relationship.
What is a typical business benefit from advanced purchase pattern analysis?
AI-powered analysis typically delivers a 12-25% improvement in pattern accuracy, an 8-20% gain in customer lifetime value, and documented cases show cost-per-acquisition reductions of around 22% through predictive modeling.
Recommended
- Sales pattern analysis: maximize e-commerce growth - Affinsy Blog | Affinsy
- How to Analyze Sales Data for Smarter E-Commerce Growth - Affinsy Blog | Affinsy
- Black Friday Sales Analysis for E-commerce Growth - Affinsy Blog | Affinsy
- How to Analyze Sales Data to Boost AOV for E-commerce - Affinsy Blog | Affinsy