
TL;DR:
- Sales pattern analysis uncovers hidden dynamics like customer retention and product relationships.
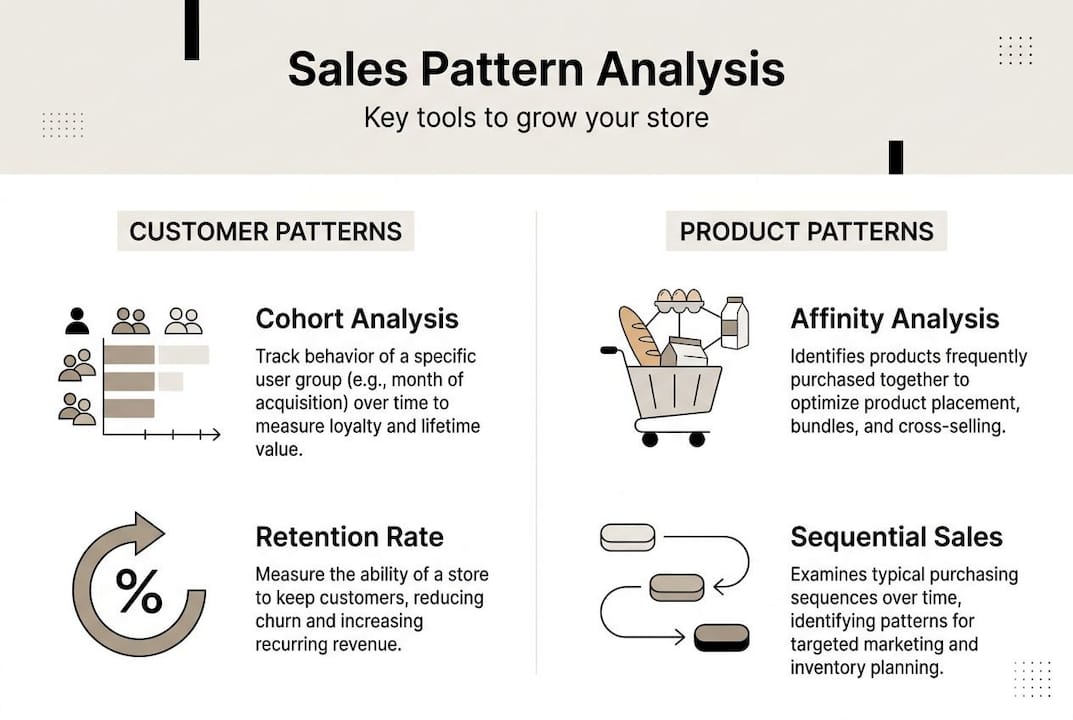
- Cohort analysis helps diagnose retention issues and identify at-risk customer segments.
- Product affinity and sequential purchase analysis enable targeted cross-sell, upsell, and personalization strategies.
Your overall revenue chart looks healthy. But underneath that single line, customer cohorts are quietly churning, product pairings are going unnoticed, and seasonal demand swings are catching your inventory team off guard. Sales pattern analysis is the practice of examining historical transaction behavior to uncover repeatable patterns that top-line metrics simply cannot show. This article walks you through the core pattern types, from trend and seasonality to cohort retention and product affinity, and explains exactly how to turn those patterns into decisions that grow revenue and keep customers coming back.
Table of Contents
- What is sales pattern analysis?
- Key types of sales patterns to analyze
- Customer retention and cohort analysis explained
- Product-level analysis: affinity and sequential purchase patterns
- Advanced segmentation with RFM analysis
- A practitioner’s perspective: What most sales pattern analysis misses
- How Affinsy empowers your sales pattern analysis
- Frequently asked questions
Key Takeaways
| Point | Details |
|---|---|
| Pattern analysis is actionable | Sales pattern analysis reveals trends, retention, and product insights that standard reports often miss. |
| Cohort and product views matter | Segmenting by cohort or product behaviors uncovers loyalty drivers and new merchandising opportunities. |
| RFM maximizes retention | Scoring customers on recency, frequency, and spend helps prioritize efforts for loyalty and revenue. |
| Choose metrics wisely | The right pattern analysis depends on your business question—be it forecasting, retention, or upselling. |
What is sales pattern analysis?
At its core, sales pattern analysis is about moving from raw numbers to structured understanding. Rather than asking “how much did we sell?”, you start asking “who bought, when, how often, and alongside what else?” That shift in framing changes everything about how you plan, market, and retain customers.
Analyzing purchase patterns in this way typically covers four major areas:
- Trend analysis: Are sales growing, plateauing, or declining over time?
- Seasonality: Which weeks or months consistently spike or dip, and by how much?
- Cohort and retention patterns: Do customers acquired in January behave differently than those acquired in July?
- Product relationships: Which items are bought together, and which purchases tend to follow others?
The reason this matters so much is that aggregate dashboards are misleading by design. A 15% revenue increase sounds great until you realize it came entirely from a one-time promotion, while your organic repeat-purchase rate actually dropped. Sales pattern analysis examines historical sales to surface exactly those hidden dynamics, giving you the context that raw totals erase.
Stat to know: Businesses that use behavioral data to personalize customer experiences report significantly higher retention rates than those relying on aggregate metrics alone.
You do not need a data science team to start. What you need is clean transactional data and a clear business question. Once you have those two things, the patterns follow.
Key types of sales patterns to analyze
With the foundations covered, let’s unpack the specific types of patterns you can analyze. Each one answers a fundamentally different business question, and choosing the wrong type for your goal is one of the most common mistakes e-commerce teams make.
| Pattern type | Business question answered | Primary use case |
|---|---|---|
| Trend and seasonality | When do sales peak or fall? | Inventory and campaign planning |
| Cohort retention | Are customers coming back? | Loyalty and lifecycle marketing |
| Product affinity | What gets bought together? | Cross-sell and bundle strategy |
| Sequential purchase | What do customers buy next? | Upsell and onboarding flows |
Each pattern type answers a different business question, whether that is forecasting demand, diagnosing churn, or powering recommendation engines. Treating them as interchangeable is a mistake that leads to vague insights and wasted effort.
For improving e-commerce retention, cohort analysis is the most direct tool. It groups customers by a shared starting point, usually their first purchase date, and tracks their behavior over time. This makes it possible to see whether retention is genuinely improving or whether new customer volume is simply masking churn.
For demand planning, sales trend analysis in e-commerce helps you separate real growth from noise. A spike in March might look exciting until you realize it happens every March. Knowing that in advance means you can stock up, run campaigns proactively, and avoid the scramble.
Cohort-based pattern analysis diagnoses retention and loyalty dynamics that are completely invisible to aggregate dashboards. That invisibility is what makes it so valuable.
Customer retention and cohort analysis explained
Diving deeper, let’s see how you can uncover the drivers of loyalty and retention. Cohort analysis starts with a simple grouping: take all customers who made their first purchase in a given month, and follow that group forward in time.

Here is what a basic retention table looks like:
| Cohort | Month 0 | Month 1 | Month 2 | Month 3 |
|---|---|---|---|---|
| January | 100% | 28% | 18% | 12% |
| February | 100% | 31% | 22% | 15% |
| March | 100% | 24% | 14% | 9% |
The March cohort shows a steeper drop. That is a signal worth investigating. Did something change in your onboarding email sequence? Was there a product quality issue? Cohort analysis shows which cohorts behave differently and surfaces the repeat-purchase and retention metrics you need to act on those differences.
Here is a practical process to get started:
- Export your order data with customer IDs and purchase dates.
- Assign each customer to a cohort based on their first purchase month.
- Calculate the percentage of each cohort that returned in subsequent months.
- Plot the retention curves and look for cohorts that drop faster than others.
- Cross-reference those cohorts with acquisition channels, promotions, or product categories to find the cause.
Pro Tip: Do not benchmark your retention rates against industry averages without context. A 20% month-two retention rate might be excellent for a consumables brand and terrible for a subscription box. Your own historical cohorts are your most honest benchmark.
For boosting retention through segmentation, cohort findings give you the raw material. Once you know which cohorts underperform, you can segment them and test targeted win-back campaigns.
Product-level analysis: affinity and sequential purchase patterns
Beyond retention, product relationships tell a different story. Two techniques dominate here: co-purchase analysis and sequential purchase mapping. They sound similar but answer very different questions.
Co-purchase analysis looks at what products appear in the same order. If 40% of customers who buy a yoga mat also buy a foam roller in the same transaction, that is a strong affinity signal. Bundle those products, feature them together on the product page, and watch average order value climb.
Sequential purchase analysis looks at what customers buy next, in a later transaction. A customer who buys a coffee grinder in January might buy specialty beans in March. That sequence is an upsell opportunity with a natural timing window.
The metric that makes both analyses actionable is lift. Lift measures how much more likely two products are to be purchased together compared to random chance. A lift score above 1.0 means the association is real. Product-level sales pattern analysis typically includes affinity and sequential logic with lift ratios as the core filter.
Practical tips for using these insights:
- Filter for lift scores above 1.5 to focus on genuinely strong associations, not coincidences.
- Use co-purchase data to build bundle offers and “frequently bought together” modules.
- Use sequential data to time post-purchase email campaigns around the natural repurchase window.
- Revisit your market basket analysis guide quarterly, since product relationships shift as your catalog evolves.
Pro Tip: Start with your top 20% of SKUs by volume. Product affinity analysis on your full catalog can produce noise. Narrowing to high-velocity items gives you cleaner, more actionable signals faster.
Advanced segmentation with RFM analysis
Segmentation strategies like RFM analysis help you maximize use of your sales patterns. RFM stands for Recency, Frequency, and Monetary value. Each dimension tells you something distinct about a customer’s relationship with your brand.
- Recency: How recently did they buy? A customer who purchased last week is far more likely to respond to an offer than one who last bought 14 months ago.
- Frequency: How many times have they purchased? High-frequency buyers are your loyalists. Low-frequency buyers with high spend are your whales worth nurturing.
- Monetary value: How much have they spent in total? This helps you identify your most economically valuable segments.
RFM segments customers by recency, frequency, and monetary value to drive targeted action, not just descriptive reporting.
Here is how to run a basic RFM analysis:
- Pull all customer transactions from the past 12 to 24 months.
- Score each customer on each dimension, typically 1 to 5, with 5 being best.
- Combine scores to create segments: Champions (5-5-5), At-Risk (low recency, high frequency), Lost Customers (low across all three).
- Map each segment to a specific campaign or action, such as a win-back sequence for At-Risk customers.
- Refresh scores monthly so your segments stay current.
For a deeper walkthrough, mastering RFM analysis covers scoring methodologies and campaign mapping in detail. You can also review the RFM analysis explained glossary entry for a quick reference.
Pro Tip: Avoid treating RFM as a one-time exercise. Customer behavior shifts constantly. A Champion from six months ago who has not bought recently is sliding toward At-Risk. Monthly refreshes catch those shifts before they become churn.
A practitioner’s perspective: What most sales pattern analysis misses
Here is the uncomfortable truth most analytics guides skip: the biggest problem in e-commerce data analysis is not a lack of data. It is choosing the wrong analysis for the question you are actually trying to answer.
Teams often run trend analysis when they should be running cohort analysis. Revenue trending upward feels reassuring. But aggregate metrics can look healthy while underlying retention erodes, and that gap between surface appearance and ground truth is where brands quietly lose their best customers.
The other common failure is over-relying on benchmarks. Industry averages are built from businesses with different price points, product types, and customer acquisition strategies. They give you a rough orientation, not a performance standard. Your own historical cohorts, your own seasonal curves, your own product affinity patterns are the only benchmarks that truly matter.
The mindset shift that actually works is treating pattern analysis as an ongoing experiment rather than a quarterly report. Run a cohort. Find an anomaly. Form a hypothesis. Test a campaign. Measure the next cohort. That loop, grounded in deep purchase analysis strategies, is what separates e-commerce teams that grow from those that just monitor.
How Affinsy empowers your sales pattern analysis
If you are ready to move from spreadsheets to structured pattern discovery, Affinsy was built for exactly this workflow.

Affinsy analyzes your historical transaction data to surface market basket associations, RFM segments, and product affinity patterns without requiring a data science team. You export your order data from Shopify, WooCommerce, BigCommerce, or any platform that produces transactional data, then upload via CSV or connect through the API. The free tier covers up to 20K line items with no credit card required. To get grounded in the core concepts, the market basket analysis explained glossary entry and the customer segmentation insights overview are great starting points before you run your first analysis.
Frequently asked questions
What is sales pattern analysis in e-commerce?
Sales pattern analysis in e-commerce is the process of examining historical sales data to uncover trends, seasonality, customer retention, and product relationships for better decision-making. It goes beyond revenue totals to reveal the behavioral dynamics driving your results.
Why is cohort analysis important for online stores?
Cohort-based analysis diagnoses retention and loyalty patterns that are hidden inside aggregate metrics, helping stores identify at-risk segments and growth opportunities before they show up in overall revenue numbers.
How can product affinity analysis increase sales?
Product affinity analysis uncovers which products are often bought together or in sequence, enabling more effective cross-sell and upsell strategies that raise average order value and purchase frequency.
What is RFM segmentation and how does it help?
RFM segmentation scores customers based on recency, frequency, and monetary value, allowing businesses to identify their most valuable and most at-risk customer groups and take targeted action on each.
Recommended
- Developing a Marketing Strategy to Maximize E-commerce Sales - Affinsy Blog | Affinsy
- How to Analyze Sales Data for Smarter E-Commerce Growth - Affinsy Blog | Affinsy
- Sales Data Analysis: Unlocking E-Commerce Growth - Affinsy Blog | Affinsy
- How to Analyze Ecommerce Sales Data for Better Growth - Affinsy Blog | Affinsy