
Research reveals that 73% of eCommerce teams lack actionable dashboards, creating a massive gap between data collection and revenue-driving decisions. This disconnect costs online retailers millions in lost opportunities every year. Ecommerce dashboards serve as the central nervous system of your digital store, transforming raw transaction data into strategic insights that guide marketing spend, inventory decisions, and customer retention efforts. This guide explains what effective dashboards truly do, why most teams struggle to extract value from them, and how you can leverage dashboard analytics to optimize sales strategies and outperform competitors in 2026.
Table of Contents
- Understanding Ecommerce Dashboards: Definition And Key Functions
- Why Many Ecommerce Teams Struggle Without Actionable Dashboards
- Impact Of Actionable Dashboards On Ecommerce Performance
- How To Leverage Ecommerce Dashboards For Optimized Sales Strategies
- Explore Advanced Ecommerce Analytics Solutions With Affinsy
Key takeaways
| Point | Details |
|---|---|
| Unified metrics interface | Dashboards consolidate sales, marketing, and customer data into one accessible view for faster decision making |
| Revenue multiplication effect | Structured analytics reviews using dashboards generate 3.7x more revenue per marketing dollar spent |
| Real-time optimization power | Live dashboards enable immediate campaign adjustments, reducing cost per acquisition by up to 44% |
| Retention advantage | Data-driven stores using actionable dashboards achieve 35% better customer retention rates |
| Decision support system | Effective dashboards suggest next actions rather than merely reporting past performance |
Understanding ecommerce dashboards: definition and key functions
An E-Commerce Dashboard is a centralized interface that provides key business metrics, analytics, and insights for online retailers. Think of it as your store’s command center where every critical number lives in one place. Instead of jumping between Google Analytics, your payment processor, email marketing platform, and inventory system, dashboards pull everything together so you can spot patterns and make decisions quickly.
The core value lies in unification. Ecommerce dashboards integrate various metrics related to sales, customer behavior, and inventory management, enabling businesses to make informed decisions. Marketing managers use them to track campaign performance across channels. Operations teams monitor inventory turnover and fulfillment speed. Analysts examine customer lifetime value trends and segment behaviors.
Most dashboards track these essential metrics:
- Sales revenue and transaction volume by channel, product category, and time period
- Customer acquisition cost, conversion rates, and average order value across marketing campaigns
- Inventory levels, stockout rates, and product performance rankings
- Customer engagement metrics like email open rates, cart abandonment, and repeat purchase frequency
- Traffic sources, bounce rates, and funnel drop-off points
The power of dashboards extends beyond simple number tracking. They transform complex datasets into visual formats that reveal opportunities invisible in spreadsheets. A well-designed dashboard highlights anomalies, like a sudden spike in cart abandonment on mobile devices or an unexpected surge in organic traffic from a specific geography. These insights enable you to act before small issues become revenue drains.
For marketing managers specifically, dashboards answer critical questions instantly. Which campaigns drive the highest lifetime value customers? What product combinations appear most frequently in high-value orders? How do retention rates differ across customer segments? Tools like data visualization ecommerce insights help translate these complex relationships into clear visual patterns that inform strategy.
Why many ecommerce teams struggle without actionable dashboards
Despite widespread dashboard adoption, 73% of eCommerce teams lack actionable dashboards, creating a fundamental gap between data collection and data-driven decision making. This structural analytics gap stems from three root causes: siloed data across platforms, insufficient analytical skills to interpret metrics, and an overreliance on vanity metrics that look impressive but don’t drive business outcomes.
Many teams confuse reporting with actionability. A dashboard showing last month’s revenue is a reporting tool. One that identifies which customer segments show declining engagement and suggests targeted retention campaigns is a decision support system. The distinction matters enormously for bottom-line results.
Common pitfalls include:
- Data overload without context or prioritization, leaving teams paralyzed by too many metrics
- Outdated or lagging indicators that report problems after they’ve already damaged revenue
- Disconnected metrics that don’t align with actual business goals or strategic priorities
- Static dashboards that require manual updates, making real-time optimization impossible
- Vanity metrics like total page views that feel good but don’t correlate with sales growth
The revenue impact of ineffective dashboards is substantial. Teams waste marketing budgets on underperforming channels because they lack the visibility to reallocate spend quickly. They miss cross-selling opportunities because product relationship data sits unused. They lose high-value customers to competitors because early warning signals of churn go unnoticed.
As one analytics expert puts it:
Dashboards should drive decisions. A dashboard that only reports what happened is a reporting tool; one that suggests what to do next is a decision-support system.
This distinction separates successful ecommerce operations from those that merely collect data. Actionable dashboards don’t just show you conversion rates dropped last week. They highlight which traffic sources experienced the decline, which product pages saw the biggest drop-offs, and which customer segments were most affected. That specificity enables targeted fixes rather than broad guesses.
The skills gap compounds the problem. Many marketing managers understand their campaigns but lack the technical expertise to build custom dashboards or query databases directly. They rely on pre-built templates that may not align with their specific business model or strategic priorities. Understanding actionable ecommerce insight 2026 guide principles helps bridge this gap by focusing on insights that directly inform decisions.
Impact of actionable dashboards on ecommerce performance
The performance gap between teams using actionable dashboards and those relying on basic reporting is dramatic. Stores with structured analytics review processes generate 3.7x more revenue per marketing dollar. This isn’t marginal improvement. It’s the difference between profitable growth and burning cash on ineffective campaigns.
The correlation extends across multiple performance dimensions. Data-driven stores achieve 28% higher revenue lift from optimization efforts compared to those making decisions based on intuition or limited data. When you can test, measure, and iterate quickly, every marketing dollar works harder. You identify winning strategies faster and kill losing ones before they drain budgets.

Customer retention shows equally impressive gains. Data-driven stores achieve 35% better customer retention by identifying at-risk customers early and intervening with targeted offers or outreach. Dashboards that track engagement scores, purchase frequency changes, and support ticket patterns enable proactive retention strategies rather than reactive damage control.
| Metric | Traditional Approach | Actionable Dashboard Approach | Improvement |
|---|---|---|---|
| Revenue per marketing dollar | $2.70 | $9.99 | 3.7x |
| Revenue lift from optimization | 12% | 28% | +133% |
| Customer retention rate | 58% | 78% | +35% |
| Time to identify issues | 2-4 weeks | Real-time | Immediate |
These improvements stem from focusing on meaningful KPIs that actually move business outcomes. Instead of celebrating vanity metrics like total site visitors, actionable dashboards prioritize revenue per visitor, customer lifetime value, cohort retention rates, and contribution margin by channel. These metrics directly connect to profitability and growth.
Pro Tip: Prioritize metrics that combine volume and value. Revenue per visitor is more actionable than traffic alone because it accounts for both conversion and order size. Similarly, customer lifetime value beats single transaction metrics by revealing which acquisition channels deliver customers who stick around and buy repeatedly.
The speed advantage matters tremendously in competitive markets. Real-time dashboards let you spot campaign performance issues within hours instead of weeks. If your Facebook ads suddenly see conversion rates drop, you can pause spending and investigate immediately rather than burning thousands more dollars before your monthly review meeting. This agility transforms marketing from a slow, batch-oriented process into a dynamic optimization engine.
Implementing actionable ecommerce analytics guide frameworks ensures your dashboards deliver these performance gains rather than just pretty charts. The focus shifts from what happened to why it happened and what to do about it.
How to leverage ecommerce dashboards for optimized sales strategies
Implementing dashboards effectively requires a systematic approach that aligns metrics with business goals and enables rapid action. E-commerce dashboards provide real-time insights into key performance indicators such as sales revenue, customer engagement, and inventory levels, enabling businesses to make informed decisions. Follow these steps to maximize dashboard value:
- Define strategic KPIs that directly impact revenue and profitability, not vanity metrics that merely look impressive
- Integrate all relevant data sources including your ecommerce platform, marketing channels, customer service tools, and inventory systems
- Configure real-time or near-real-time data refresh to enable immediate response to performance changes
- Set up automated alerts for critical thresholds like inventory stockouts, campaign performance drops, or customer churn signals
- Establish regular review cadences with clear owners responsible for acting on dashboard insights
- Document decision frameworks that translate dashboard signals into specific actions
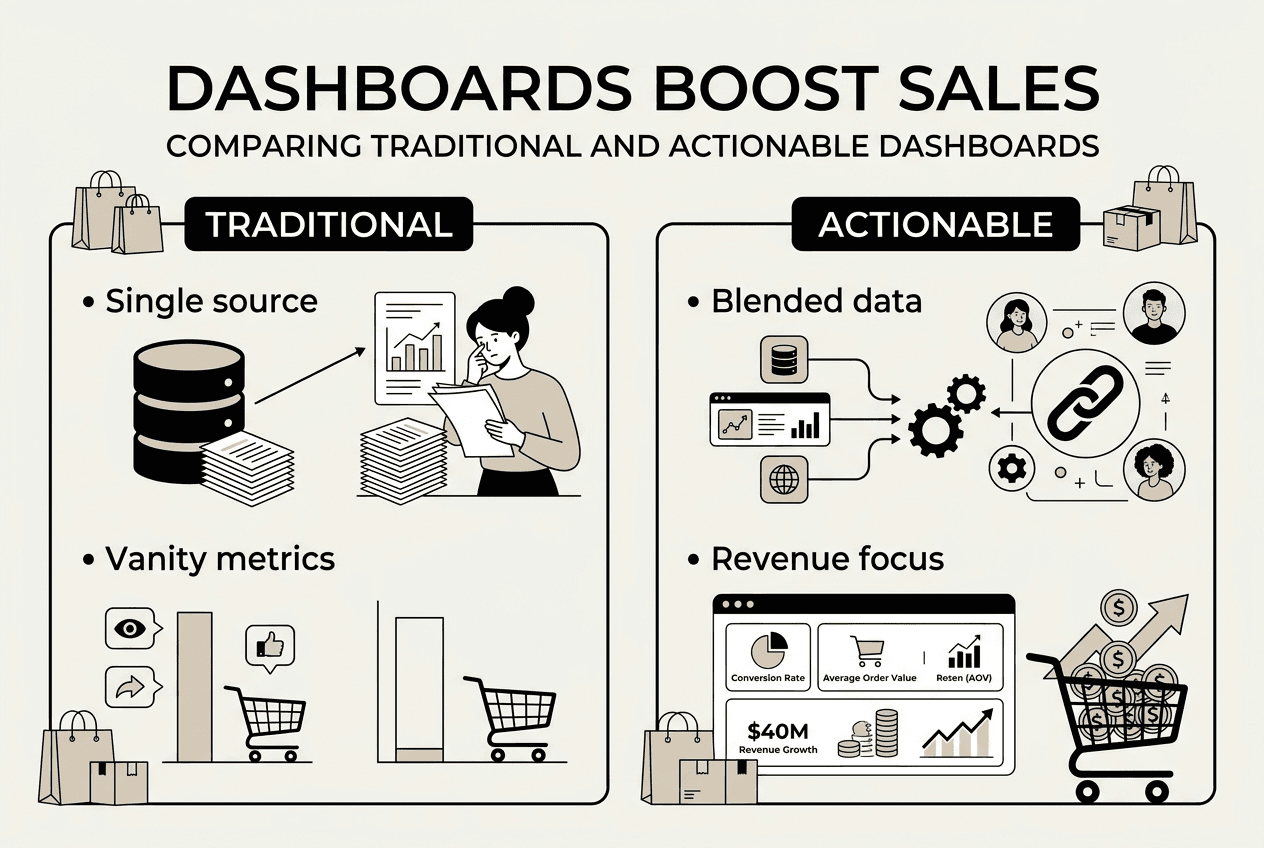
The choice between traditional single-source dashboards and blended data approaches significantly impacts effectiveness:
| Aspect | Traditional Dashboard | Blended Data Dashboard |
|---|---|---|
| Data sources | Single platform (e.g., Google Analytics only) | Multiple integrated sources (GA, ad platforms, CRM, inventory) |
| Attribution accuracy | Often inflated, paid search over-credited by 30-50% | Cross-platform validation reduces attribution errors |
| Update frequency | Daily or weekly batches | Real-time or hourly |
| Decision speed | Slow, requires manual data gathering | Immediate, all context in one view |
| Setup complexity | Low | Moderate to high |
Real-time blended dashboards deliver exceptional returns. E-commerce brands can significantly improve ROAS by using real-time blended data dashboards. Studies show return on ad spend improvements of 38% and cost per acquisition reductions of 44% when teams can see true cross-channel performance and optimize accordingly.
The attribution correction alone justifies the investment. Last-click models typically over-credit bottom-funnel channels like paid search while ignoring the awareness and consideration work done by social media, content marketing, and display ads. Blended dashboards reveal the true customer journey, enabling smarter budget allocation across the full funnel.
Pro Tip: Use campaign performance dashboards to reallocate budgets weekly instead of monthly. If your dashboard shows Instagram ads delivering 40% higher lifetime value customers than Facebook at 20% lower cost per acquisition, shift budget immediately. Waiting until month end costs you profitable sales every day.
Alignment between dashboard metrics and team incentives ensures insights drive action. If your marketing team gets bonuses based on traffic growth but your dashboard prioritizes revenue per visitor, expect misaligned behavior. Make sure compensation, performance reviews, and strategic planning all reference the same core metrics visible in your dashboards.
Implementing a workflow for actionable ecommerce insights creates the operational discipline to turn dashboard data into consistent results. Choosing the right best ecommerce analytics tools 2026 6 ensures your technology stack supports rather than hinders this workflow.
Explore advanced ecommerce analytics solutions with Affinsy
While dashboards provide essential visibility into current performance, advanced analytics unlock hidden growth opportunities in your existing customer data. Affinsy enhances your dashboard strategy by adding predictive intelligence, deep customer segmentation, and product relationship insights that most standard dashboards miss entirely.

Our platform analyzes your historical transaction data to identify which products customers frequently buy together, revealing bundling and cross-selling opportunities that can increase average order values by 15 to 25%. Predictive analytics capabilities forecast which customers are likely to churn, enabling proactive retention campaigns before they defect to competitors. Customer segmentation goes beyond basic demographics to group buyers by actual purchasing behavior, lifetime value potential, and engagement patterns.
Market basket analysis reveals non-obvious product associations that inform merchandising, email campaigns, and website recommendations. These insights integrate seamlessly with your existing dashboards, adding a predictive and prescriptive layer on top of descriptive reporting. The result is a complete analytics ecosystem that tells you what happened, why it happened, what’s likely to happen next, and what to do about it.
FAQ
What metrics should an ecommerce dashboard prioritize?
Prioritize revenue-focused metrics like total revenue, transaction volume, average order value, customer lifetime value, and cohort retention rate. These directly reflect business health and growth trajectory. Avoid vanity metrics like total page views or social media followers that don’t correlate with profitability. Focus on metrics that guide specific decisions, such as revenue per visitor for optimizing traffic sources or contribution margin by channel for budget allocation.
How do actionable dashboards improve marketing ROI?
They enable structured review processes that generate 3.7x more revenue per marketing dollar by identifying high-performing campaigns quickly and reallocating budgets from underperformers. Real-time insights help optimize targeting, creative, and bidding strategies while campaigns are still running rather than after budgets are spent. Dashboards that connect marketing spend to customer lifetime value rather than just initial conversions reveal which channels deliver the most profitable long-term customers. Learn more about building this capability through actionable ecommerce analytics guide frameworks.
What common pitfalls should be avoided when using dashboards?
Avoid tracking vanity metrics that don’t drive decisions, maintaining siloed data that prevents cross-channel analysis, and building dashboards that only report past events without suggesting actions. Don’t overwhelm users with too many metrics or create dashboards that require manual updates. Focus on insights that guide specific decisions rather than general awareness. Ensure your dashboards answer the question “what should we do differently?” not just “what happened?” Understanding actionable ecommerce insight 2026 guide principles helps avoid these traps.
How quickly can dashboards impact ecommerce sales?
Impact varies by implementation quality and organizational readiness, but studies show data-driven stores achieve up to 28% revenue lift and 35% better retention within months of implementing actionable dashboards. Real-time blended dashboards can boost return on ad spend by 38% and reduce cost per acquisition by 44% even faster, sometimes within weeks. The key is combining dashboard visibility with clear decision frameworks and empowered teams authorized to act on insights immediately rather than waiting for approval cycles.
Recommended
- Ecommerce Data Visualization for Sales Growth - Affinsy Blog | Affinsy
- Data Visualization in Ecommerce: Driving Sales With Insight - Affinsy Blog | Affinsy
- How to Analyze Ecommerce Sales Data for Better Growth - Affinsy Blog | Affinsy
- E-commerce Data Analysis Tutorial: Boost Sales with Insights - Affinsy Blog | Affinsy
- B2B Sales Funnel optimieren: Mehr Leads und Abschlüsse sichern