
TL;DR:
- Total sales represent a company’s gross revenue from all product and service sales before deductions.
- Calculating it involves summing units sold multiplied by their respective prices across all channels and SKUs.
Your sales total is your business’s top-line revenue: the full dollar amount generated from selling products or services before any deductions. The formula is straightforward:
Total Sales = Σ (Units Sold × Price Per Unit)

For a multi-product store: (Units Sold, Product A × Price A) + (Units Sold, Product B × Price B) + … and so on across every SKU. This figure is pre-adjustment — it does not subtract returns, discounts, or allowances. That distinction matters the moment you start comparing reports across teams or tools.
Pro Tip: Label this metric “Gross Sales” or “Total Gross Sales” in every internal report. Using “sales” alone invites confusion with net sales, which is a different number.

Table of Contents
- What your total sales figure actually includes (and what it doesn’t)
- How to calculate your sales total: formulas and worked examples
- Accounting notes: where total sales sits and what ASC 606 changes for subscriptions
- How to check and track your sales total across platforms and accounting systems
- Best practices and common mistakes when using sales total as a KPI
- When total sales is the right metric and what to pair with it
- Turn your sales total into revenue tests with transaction-level analysis
- Key Takeaways
- The metric that tells you everything and nothing at once
- Affinsy turns your transaction data into revenue tests
- Useful sources and further reading
What your total sales figure actually includes (and what it doesn’t)
Knowing the boundary of this metric prevents the most common reporting errors. Here is what belongs in a gross sales total and what gets handled separately.
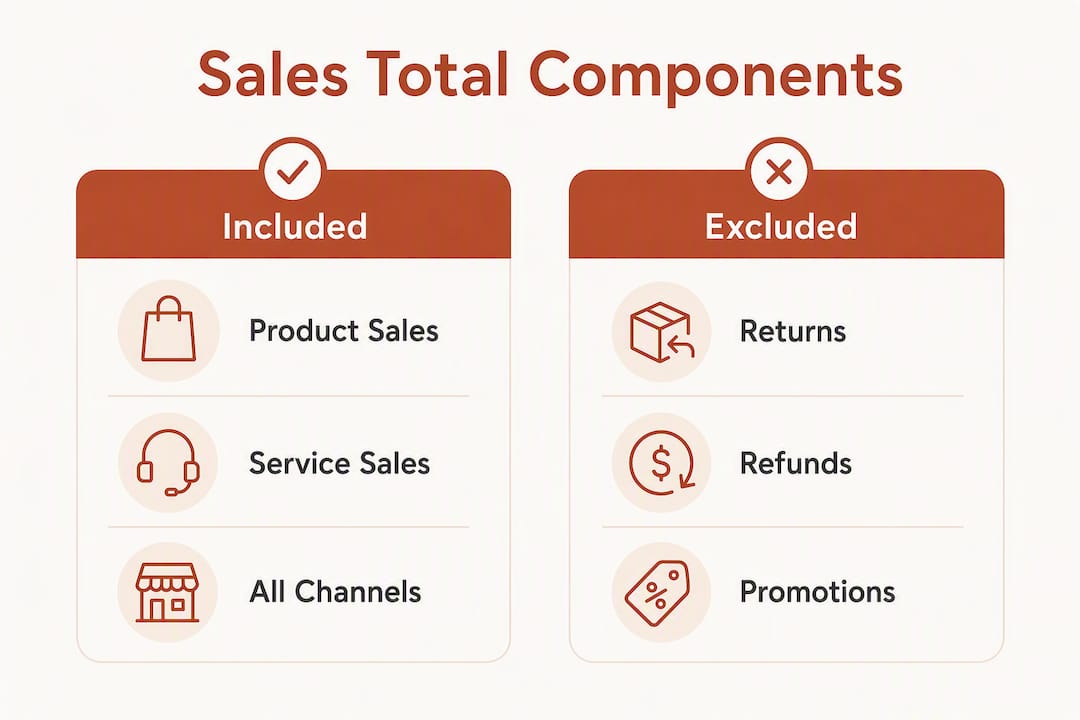
Included in total sales:
- Revenue from all products and services sold during the period
- Sales across every channel: online store, in-store POS, marketplace, and wholesale
- Shipped or delivered orders (under accrual accounting, revenue is recognized when the performance obligation is satisfied, not when cash arrives)
- Subscription charges billed in the period (with important caveats covered in Section 4)
Excluded from total sales (or deducted to reach net sales):
- Customer returns and refunds
- Discounts and promotional allowances
- Sales tax collected (this is a liability, not revenue)
- Shipping revenue, depending on your company’s accounting policy
- Non-operating income: interest earned, gains on asset sales, and similar items that have nothing to do with your products
| Included | Excluded / Deducted Later |
|---|---|
| Product and service sales | Returns and refunds |
| All sales channels | Discounts and allowances |
| Delivered performance obligations | Sales tax collected |
| Subscription billings (period) | Non-operating income |
| Marketplace and wholesale revenue | Shipping (policy-dependent) |
Pro Tip: Write a one-paragraph internal definition of “total sales” and share it with every team that touches revenue reporting. Finance, marketing, and operations often use the same word to mean different things, and that gap shows up in board decks at the worst possible moment.
How to calculate your sales total: formulas and worked examples
The core formula is simple. The execution gets interesting when you have multiple SKUs, variable pricing, or mixed channels.
Single-product formula:
Total Sales = Units Sold × Price Per Unit
Multi-product formula:
Total Sales = (Units A × Price A) + (Units B × Price B) + (Units C × Price C) + …
For average price considerations: use the actual transaction price when your data has it (it usually does in a CSV export). Use an average price only when you are estimating from aggregate data and do not have line-item detail.
Worked Example 1: Single-product sales day
A Shopify store sells one candle SKU at $28.00. On Tuesday, 47 units ship.
Total Sales = 47 × $28.00 = $1,316
Worked Example 2: Multi-SKU weekly total
| SKU | Units Sold | Unit Price | Line Total |
|---|---|---|---|
| Candle — Cedar | 47 | $28.00 | $1,316 |
| Candle — Lavender | 47 | $28.00 | — |
| Gift Set | 12 | $54.00 | — |
| Weekly Total | — | $2,956 |
That $2,956.00 is your gross sales total for the week. No tax, no shipping, and no refunds subtracted yet.
Consolidating across channels: when you sell on your own store, Amazon, and in a physical location simultaneously, pull separate exports from each channel, strip out any inter-channel transfers, and sum the line totals. Watch for orders that appear in both a marketplace export and your fulfillment system — that double-count is one of the most common reconciliation errors in multi-channel retail.
Pro Tip: When building a consolidation spreadsheet, add a “source” column (Shopify, Amazon, POS) to every transaction row. Filtering by source lets you spot duplicates and audit each channel independently before summing.
Accounting notes: where total sales sits and what ASC 606 changes for subscriptions
Total sales appears as the first line on a multi-step income statement. The flow looks like this:
- Gross Sales (Total Sales) — top line
- Less: Returns, Discounts, Allowances — adjustments
- Net Sales — what most P&Ls call “Revenue”
- Less: Cost of Goods Sold (COGS)
- Gross Profit
- Less: Operating Expenses
- Net Income
Net sales is the number your accountant and most financial reports focus on:
For most product-based e-commerce stores, gross sales and net sales are close. For stores with heavy promotions or high return rates, the gap can be significant.
The ASC 606 consideration for subscriptions
Under ASC 606, revenue is recognized when performance obligations are satisfied, not when the customer pays. For a SaaS or subscription box business, a customer paying $120 upfront for an annual plan does not generate $120 in recognized sales on day one. It generates $10 per month as each month’s obligation is fulfilled.
This matters for e-commerce managers who sell subscription products alongside one-time purchases. Your platform may report the full $120 as a “sale” at checkout. Your accrual-basis income statement should show only the earned portion. Mixing these two views in the same report produces a number that is neither gross sales nor recognized revenue.
Pro Tip: In your order exports, add a column that flags each transaction as “one-time” or “subscription.” That single tag lets you split the two revenue streams before any analysis and keeps your ASC 606 reporting clean.
How to check and track your sales total across platforms and accounting systems
Every major platform reports a version of total sales, but the labels and inclusions vary. Here is what each one typically shows:
| Platform | Where to Find It | What It Usually Includes |
|---|---|---|
| Shopify | Analytics → Reports → Sales | Gross sales (pre-discount, pre-return) |
| WooCommerce | WooCommerce → Reports → Sales | Net sales by default (post-discount) |
| Stripe | Dashboard → Revenue | Gross charge volume |
| Square | Reports → Sales Summary | Gross sales including taxes (separate column) |
| QuickBooks | Reports → Profit & Loss | Net sales (post-returns) |
| NetSuite | Reports → Financial → Income Statement | Gross and net sales, configurable |
Because each platform defines “sales” slightly differently, reconciling via CSV export is the most reliable verification method.
CSV reconciliation checklist:
- Export transaction-level data (one row per order line) for the period
- Confirm each row has: order ID, date, SKU, quantity, unit price, line total, payment status
- Filter to “paid” or “completed” status only; exclude pending and failed
- Sum the line total column and compare to the platform’s reported total
- Pull a separate list of refunds for the same period; confirm they are excluded from gross sales
- Check for duplicate order IDs (a common sign of multi-channel double-counting)
- Verify that sales tax appears in a separate column, not baked into the line total
Sample CSV structure for reconciliation:
| Order ID | Date | SKU | Qty | Unit Price | Line Total | Status |
|---|---|---|---|---|---|---|
| 10043 | June 3 | CNDL-CED | 2 | $28.00 | $56.00 | Paid |
| 10043 | June 3 | GIFT-SET | 1 | $54.00 | $54.00 | Paid |
| 10043 | June 4 | CNDL-LAV | 3 | $28.00 | — | Refunded |
Sum the “Paid” rows only: $56.00 + $54.00 = $110.00 gross sales. Order 10043 is excluded from gross sales and tracked separately as a return.
For a practical walkthrough of building sales reports from transactional data, the process maps directly to this reconciliation logic.
Best practices and common mistakes when using sales total as a KPI
Best practices:
- Define the metric once, in writing. Gross sales, net sales, and recognized revenue are three different numbers. Pick the one your team tracks and document exactly what it includes.
- Align periods across channels. A Shopify report running midnight-to-midnight UTC and a Square POS running midnight-to-midnight EST will produce different daily totals for the same business.
- Automate the reconciliation. A scheduled export and a simple spreadsheet formula that flags when platform total and CSV sum diverge by more than $1.00 catches errors before they compound.
- Label your exports with the period and definition. “sales_june2026_gross_shopify.csv” is unambiguous. “sales_export.csv” is not.
- Break annual targets into monthly goals and track progress weekly. Waiting until Q4 to notice you are 30% behind an annual target leaves almost no time to course-correct.
Common mistakes:
- Confusing gross and net sales. WooCommerce reports net by default; Shopify reports gross. Comparing them directly overstates the gap between channels.
- Including non-operating income. Interest income and gains from selling equipment are not sales. Keep them off the sales line or your sales team performance metrics will look artificially inflated.
- Ignoring return timing. A return processed in July for a June order can distort both months if you are not tracking it carefully.
- Double-counting multi-channel orders. One order fulfilled from your warehouse but placed on a marketplace appears in both your fulfillment system and the marketplace export. Strip duplicates before summing.
Pro Tip: Set a monthly “sanity check” alert: if your gross sales total changes by more than 20% week-over-week with no corresponding campaign or seasonal event, flag it for manual review before it hits a report.
When total sales is the right metric and what to pair with it
Total sales is the right north-star metric when you are tracking volume, measuring campaign lift, or setting top-line revenue targets. It answers “how much did we sell?” cleanly and quickly. The U.S. Census Bureau uses exactly this measure for its national retail benchmarks, reporting total U.S. retail and food services sales increased compared to the previous year, reflecting growth in the market. That is gross sales at scale: no margin, no cost, just volume.
Where total sales misleads: profitability decisions, cash flow planning, and customer quality assessments. A store generating $500,000 in gross sales with a 10% gross margin and a 25% return rate is in a very different position than one generating $300,000 with a 55% margin and a 3% return rate.
Metrics to review alongside your sales total:
- Net sales — gross sales minus returns, discounts, and allowances; the number your P&L actually uses
- Gross margin — (Net Sales − COGS) ÷ Net Sales; tells you whether growth is profitable
- Average order value (AOV) — total sales ÷ number of orders; rising AOV with flat order count is a healthy signal
- Refund rate — refunds ÷ gross sales; a rising rate erodes net sales faster than most managers notice
- Customer lifetime value (CLTV) — total revenue per customer over their relationship with you
- Conversion rate — orders ÷ sessions; flat sales with rising traffic means conversion is the problem, not demand
- Churn rate (for subscription businesses) — customer loss rate that directly reduces future total sales
The rising-sales-falling-margin scenario: if your monthly sales total climbs 15% but gross margin drops from 48% to 38%, you are likely discounting too aggressively or your product mix has shifted toward lower-margin SKUs. Total sales alone would look like a win. Gross margin tells the real story. For a deeper look at e-commerce metrics to track alongside revenue, pairing these numbers is where the real analysis starts.
Turn your sales total into revenue tests with transaction-level analysis
A gross sales figure tells you how much. Transaction-level data tells you why and what to do next. Here is a repeatable process for turning a sales total into a concrete revenue test:
- Run a market basket analysis — Find which products are bought together most often. A candle store might discover that 38% of customers who buy the cedar candle also buy the matching diffuser within 30 days — but only 4% are shown both at checkout. That gap is a bundle opportunity.
Affinsy automates steps 2 and 3. You upload your transaction CSV (or connect via API), and the platform surfaces product associations and RFM customer segments without requiring any data science work. The free tier handles up to 20,000 line items with full product access and no credit card required, which is enough to run a meaningful first analysis for most mid-size stores.
Pro Tip: Start your first bundle test with SKUs that already appear in the top 20% of your sales total by volume. They have the traffic to generate results fast, and a lift there moves the top-line number visibly.
For more on sales data analysis tactics that connect transaction-level insight to revenue outcomes, the process above maps directly to what works in practice.
Key Takeaways
Your sales total is gross revenue before adjustments: calculate it correctly, reconcile it against transaction-level data, and pair it with margin and refund metrics before making any business decision.
| Point | Details |
|---|---|
| Core formula | Total Sales = Σ (Units Sold × Price Per Unit), summed across all SKUs and channels. |
| Gross vs. net | Net Sales = Gross Sales − Returns − Discounts − Allowances; never use the two interchangeably. |
| ASC 606 for subscriptions | Subscription revenue is recognized over time as obligations are fulfilled, not at the moment of payment. |
| Reconcile via CSV | Export transaction-level data, filter to paid orders, sum line totals, and compare to platform-reported figures to catch errors. |
| Affinsy for next steps | Upload your transaction CSV to Affinsy to run market basket analysis and RFM segmentation on the data behind your sales total. |
The metric that tells you everything and nothing at once
Total sales is the number everyone asks for first and the one that answers the fewest questions on its own. Watching it climb feels good. Watching it climb while your gross margin quietly compresses and your refund rate ticks upward is a different experience entirely.
The stores that use gross sales well treat it as a volume signal, not a health signal. They set it as a top-line target, break it into monthly milestones, and then immediately ask what drove the number. Which SKUs? Which channels? Which customer segments bought twice versus once? Those follow-up questions are where the actual decisions live.
The most common mistake I see is treating a rising sales total as permission to stop digging. A 20% revenue increase built on aggressive discounting, a single viral month, or a product mix shift toward low-margin items is not the same as a 20% increase built on repeat customers and healthy AOV growth. The top line looks identical. The business underneath does not.
If you are going to track one number, track gross sales. But build the habit of pulling net sales, gross margin, and refund rate in the same view, every time. The total tells you the score. The other metrics tell you whether you are actually winning.
Affinsy turns your transaction data into revenue tests
Most stores already have the data they need to grow. The gap is between a gross sales number sitting in a dashboard and knowing which product pairs, customer segments, or timing patterns are driving it.
Affinsy connects to your existing order data via CSV upload or API — no direct platform integration required. You export from Shopify, WooCommerce, Stripe, or any system that produces transaction records, and Affinsy runs market basket analysis and RFM customer segmentation on that data. The output is a ranked list of bundle opportunities, cross-sell pairings, and customer segments you can export directly to Klaviyo, MailerLite, or Omnisend for targeting.

The free tier covers up to 20,000 line items with full product access and no credit card required. Paid plans start at $49/month (Pro) and $199/month (Max) for larger datasets and API access. Enterprise pricing is available on request.
If you want to move from “my sales total is up 12%” to “here is the bundle test that drove it and here is the segment to retarget next month,” start with the free tier at Affinsy and upload last month’s transaction export.
Useful sources and further reading
- Gross Sales: What It Is, How To Calculate It, and Examples — Investopedia’s definition of gross sales and the net sales adjustment formula; supports the includes/excludes and accounting sections.
- What Is Total Sales Revenue? | NetSuite — NetSuite’s guide to total sales revenue, income statement placement, and ASC 606 revenue recognition for subscriptions.
- Advance Monthly Sales for Retail and Food Services — U.S. Census Bureau — primary source for U.S. retail sales benchmarks, including the June 2026 national total used in the interpretation section.
- Total Sales: What It Measures and How to Track It — practical KPI guidance on pairing total sales with profitability metrics and setting monthly targets.
Recommended
- Guide to E-Commerce Data Analysis for Increased Sales - Affinsy Blog | Affinsy
- Complete Guide to Ecommerce Manager Job Description - Affinsy Blog | Affinsy
- How to Maximize Average Order Value for E-Commerce Stores - Affinsy Blog | Affinsy
- Developing a Marketing Strategy to Maximize E-commerce Sales - Affinsy Blog | Affinsy