
TL;DR:
- Most e-commerce teams underutilize transaction data, missing opportunities to improve retention and profits. Analyzing detailed purchase records with cohort and market basket techniques reveals customer behaviors and product relationships to inform targeted marketing strategies. Automating this process with platforms like Affinsy enables businesses to derive actionable insights and close the feedback loop for continuous growth.
Most e-commerce teams sit on a gold mine and treat it like a filing cabinet. Your platform records every purchase, timestamp, payment method, and product combination, yet transaction data analysis remains one of the most underused practices in mid-to-large online brands. The gap between collecting data and acting on it is where revenue quietly disappears: customers churn undetected, underperforming products stay on digital shelves, and high-value acquisition channels get the same budget as low-quality ones. This guide closes that gap with practical, field-tested methods.
Table of Contents
- Understanding transaction data and its value in e-commerce
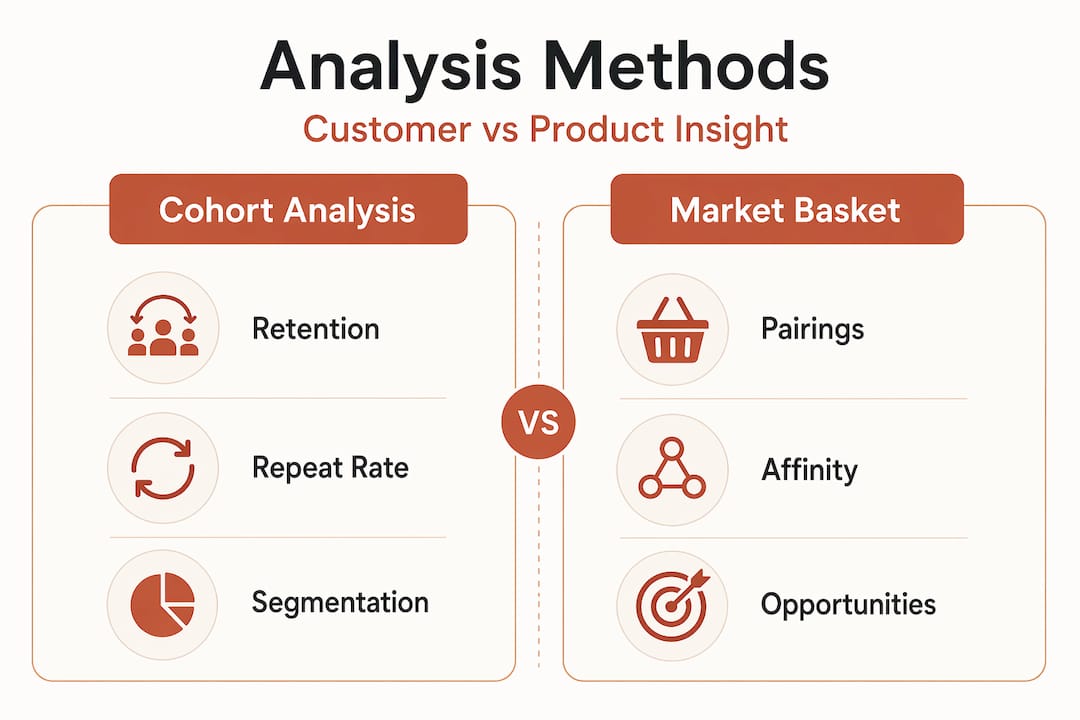
- Cohort analysis: uncovering customer retention patterns in transaction data
- Market basket analysis: revealing product relationships and opportunities
- Nuances and pitfalls in transaction data analysis
- From descriptive insights to predictive applications in marketing
- Our take: stop treating transaction analysis as a reporting function
- See your transaction data work for you with Affinsy
- Frequently asked questions
Key Takeaways
| Point | Details |
|---|---|
| Understand transaction data | Transaction data captures detailed purchase records and contextual information essential for e-commerce insights. |
| Leverage cohort analysis | Grouping customers by acquisition date reveals true retention trends hidden in aggregate numbers. |
| Use market basket analysis | Analyzing product co-purchases identifies cross-selling and bundling opportunities that boost sales. |
| Avoid common pitfalls | Proper cohort definitions and natural repurchase windows ensure accurate retention measurement. |
| Combine descriptive and predictive | Layering predictive models on transaction data enables targeted, timely marketing for higher retention. |
Understanding transaction data and its value in e-commerce
To meaningfully analyze transaction data, we first need to understand its components and business significance.
Transaction data analysis involves analyzing detailed transaction records aggregated over time to uncover patterns in customer behavior and operations. At the most basic level, transaction data includes:
- Order ID and timestamp: when each purchase occurred
- Customer identifier: linking purchases to individuals across sessions
- Product and SKU details: what was bought, in what quantity, at what price
- Payment method and status: credit card, buy-now-pay-later, refunded or completed
- Geographic data: shipping address or billing region
- Channel attribution: organic search, paid social, email campaign, or direct
Each of those fields is a lens. Alone, none of them tells you much. Together, they create a behavioral fingerprint for every customer. A customer who bought a winter jacket in November via a paid Instagram ad, paid with a credit card, and ordered from a suburban zip code is not the same segment as a customer who bought the same jacket in February via email, used a gift card, and lives in a city center. Your e-commerce data analysis guide strategy should treat those two buyers differently from the moment they convert.
The richness of this data is what makes financial data analysis so consequential for product and marketing decisions. Transaction records reveal which products lose steam after a promotional push, which customer cohorts generate repeat revenue, and where operational bottlenecks cluster by time of day or geography.
Cohort analysis: uncovering customer retention patterns in transaction data
With a clear grasp of transaction data, cohort analysis is the natural next step to diagnose retention and loyalty trends.
Cohort analysis groups customers by the month of their first purchase and tracks what percentage of them come back to buy again in subsequent months. Cohort retention tables show the percentage of customers acquired in a period who purchase again over subsequent periods, revealing whether retention stabilizes or declines. That stabilization point is critical: a healthy cohort curve flattens out, meaning a reliable base of customers keeps returning. A curve that continues falling toward zero means you are running an acquisition business, not a retention one.
Here is what a simplified cohort table looks like for a hypothetical apparel brand:
| Acquisition month | Month 1 | Month 2 | Month 3 | Month 6 |
|---|---|---|---|---|
| January 2025 | 100% | 28% | 19% | 14% |
| February 2025 | 100% | 31% | 22% | 16% |
| March 2025 | 100% | 24% | 15% | 9% |
The March cohort is a warning sign. Customers acquired that month retained far worse by month six. The question is why: was there a discount-driven promotion that attracted bargain hunters? Did a new acquisition channel launch that month? Cohort analysis does not answer those questions automatically, but it tells you exactly where to look.
GA4 cohort analysis with a purchase event as the return criterion gives repeat purchase rates by acquisition cohort, offering more diagnostic clarity than aggregate repeat rates. This matters because aggregate repeat purchase rate hides cohort-level decay. A brand with a 35% repeat rate overall may be masking the fact that customers acquired via paid social repeat at 18%, while email-acquired customers repeat at 52%. Without cohort-level transaction analytics, marketing budget flows toward volume, not quality.
- Identify which acquisition months produced your most loyal cohorts
- Cross-reference high-retention cohorts with campaign data to find repeatable patterns
- Set retention benchmarks by cohort, not by overall averages
- Use retention curve shape (flat vs. declining) to prioritize win-back campaigns
Pro Tip: Do not benchmark your cohort retention against industry averages. Benchmark against your own best cohort. Your top-performing cohort defines what is achievable with your product and audience.
Market basket analysis: revealing product relationships and opportunities
Just as cohort analysis reveals customer patterns, market basket analysis adds clarity on product relationships that inform sales strategies.

Market basket analysis (MBA) is a data mining technique that identifies which products are frequently purchased together within the same transaction. The output is a map of product associations that tells you what to bundle, what to recommend at checkout, and where to place products in your catalog. MBA often starts with frequent item pair self-joins in SQL, but confidence metrics must validate associations beyond raw co-purchase frequency.
Here is the distinction that trips up most teams. Raw co-occurrence counts are misleading. If you have a best-selling item that appears in 60% of all orders, it will show up as “associated” with almost everything simply because it is popular. That is not a meaningful association. You need two key metrics:
- Support: the percentage of all transactions that contain both products. This filters out pairs that appear together only rarely.
- Confidence: the percentage of transactions containing product A that also contain product B. High confidence means that when someone buys A, they very likely buy B too.
- Lift: the ratio of observed co-purchase frequency to what you would expect if the two products were bought independently. A lift above 1.0 means the association is stronger than chance.
| Metric | What it measures | When to use it |
|---|---|---|
| Support | How common the pair is across all orders | Filter out rare combinations |
| Confidence | Likelihood B is bought given A | Identify reliable cross-sell triggers |
| Lift | Strength of association beyond popularity | Confirm the pair is genuinely linked |
A practical starting point: filter pairs with support above 1% and confidence above 30%, then sort by lift. The combinations that survive those filters are actionable, not just popular.
Pro Tip: Run MBA separately on first-time buyer transactions and repeat buyer transactions. New customers and loyal customers often buy in very different combinations, which means your cross-sell recommendations should differ by segment too.
You can go deeper on the methodology with this market basket analysis tutorial and reference the core concepts in the market basket analysis glossary. The insights translate directly into product page recommendations, email bundles, and checkout upsell modules.
Nuances and pitfalls in transaction data analysis
Recognizing common analysis pitfalls helps ensure transaction data insights accurately reflect business realities.
The biggest mistake teams make is treating transaction data as self-explanatory. It is not. Every analysis choice you make shapes the story the data tells, and a wrong choice can send you in the opposite direction from where you should go.
“Retention measurement breaks down if the repeat window is fixed arbitrarily. Best practice is to derive repurchase windows from the median time to second order and adjust accordingly.”
If your customers naturally repurchase every 90 days, measuring repeat purchase rate at 30 days will always look low, and you will over-invest in win-back campaigns for customers who were never actually churned. Median time to second order is the right anchor.
Cohort definition choices around first purchase versus acquisition date, and the selection of the return event, materially affect how you evaluate customer quality and campaign performance. A cohort defined by the first purchase date and a cohort defined by the ad click date can show entirely different retention curves for the same group of customers.
Common pitfalls to avoid in transaction performance metrics and analysis:
- Duplicate transactions: GA4 can double-count purchase events when tag implementations fire multiple times. Audit your event data before building any cohort or retention model.
- Popularity bias in MBA: filtering by support and confidence removes noise, but also validate that your top-ranked pairs make intuitive product sense. A statistical association between trash bags and kitchen knives might reflect a promotion, not a meaningful behavioral pattern.
- Inconsistent attribution windows: comparing campaigns that use different attribution models in the same cohort report produces conclusions that are not comparable.
- Ignoring seasonality: a cohort acquired in November behaves differently from one acquired in July because holiday buyers have different intent and repurchase patterns.
The essential e-commerce analysis tips that separate good analysts from great ones are almost always about these definitional decisions, not the analysis tools themselves.
Pro Tip: Before running any cohort or MBA analysis, document your cohort inclusion rule, your return event definition, and your repeat purchase window. Treating these as fixed choices, not afterthoughts, makes your findings reproducible and comparable over time.
From descriptive insights to predictive applications in marketing
Moving beyond descriptive understanding, predictive approaches translate transaction data into actionable marketing strategies.
Descriptive analysis tells you what happened. Cohort tables show past retention. MBA shows past co-purchases. Both are backward-looking by design, and that is fine as a starting point. But the next layer, predicting future behavior, is where transaction data analysis pays the biggest dividends for marketing teams.
Combining descriptive cohort insights with predictive modeling enables marketers to decide who to target and when, maximizing campaign ROI. In practice, this works as a sequence of steps:
- Identify your best cohorts using retention tables and RFM (Recency, Frequency, Monetary) scoring derived from transaction history.
- Model churn propensity by identifying the behavioral signals that preceded past customer exits, such as declining order frequency or a drop in average order value.
- Score active customers on their likelihood to churn, repurchase, or respond to a cross-sell, using those signals.
- Trigger interventions at the right moment: a win-back email when churn risk crosses a threshold, a bundle recommendation when purchase probability is high, a loyalty incentive when a customer is close to a frequency milestone.
- Measure lift, not just outcomes. Compare conversion rates for customers who received the predictive trigger against a holdout group who did not.
This framework connects your predictive analytics for retail growth approach directly to the transaction records you already have. You do not need a data science team to implement it. Platforms that automate RFM segmentation and surface predictive signals from your transaction history can handle the modeling, leaving your team to focus on the campaigns themselves.
Real-time transaction tracking adds another dimension here. When a customer makes a purchase that matches a high-confidence MBA association, that event can trigger an immediate cross-sell recommendation in a post-purchase email. The transaction becomes the trigger, not just a record.
Our take: stop treating transaction analysis as a reporting function
Most brands treat transaction data analysis as a reporting activity. Someone pulls a monthly revenue summary. Someone checks average order value. Someone builds a dashboard that shows yesterday’s sales. That is not analysis; that is accounting with a better interface.
The brands we see getting the most out of their transaction data treat it as a decision-making input, not a performance summary. The question is never “what did we sell last month?” The question is “which customer behaviors predict high lifetime value, and how do we find more of them?” That reframe changes everything, from how you define cohorts to how you structure your marketing calendar.
There is also an uncomfortable truth about where most analysis fails: it is not the tools, and it is not the data quality. It is the absence of a feedback loop. Teams run a cohort analysis, spot a retention drop in the March cohort, launch a win-back campaign, and never measure whether that campaign actually improved retention for that cohort. Without closing the loop, you are just generating observations, not building knowledge.
The best practice in data analysis is not a methodology or a tool. It is a habit of connecting every insight to a decision, every decision to a test, and every test to a result that feeds back into the next analysis cycle.
See your transaction data work for you with Affinsy
If you have been running these analyses manually, or not running them at all because the setup felt too technical, Affinsy was built specifically for this workflow.

Affinsy takes your existing transaction data, whether exported from Shopify, WooCommerce, Stripe, or any other platform, and automatically surfaces market basket associations, RFM customer segments, and retention patterns without requiring any data science skills. You connect via API, CSV upload, or MCP and start seeing business transaction insights within minutes. The permanent free tier covers up to 20K line items with full product access and no credit card required. For larger datasets and API access, Pro starts at $49/month and Max at $199/month. If your data volume or use case is larger, enterprise pricing is available on request.
Frequently asked questions
What is transaction data analysis in e-commerce?
It involves examining detailed purchase and payment records over time to uncover customer behaviors, product trends, and operational insights for better decisions. Transaction data analysis examines detailed financial transaction records to surface meaningful insights about customer behavior and operations.
How does cohort analysis improve understanding of customer retention?
Cohort analysis groups customers by acquisition period and tracks their repeat purchases over time, revealing retention trends that aggregate data masks. Cohort retention tables show the percentage of customers acquired in a period who purchase again, revealing whether retention stabilizes or declines.
Why is market basket analysis useful for e-commerce marketing?
It identifies products frequently bought together from transaction data, enabling effective cross-selling, bundling, and merchandising strategies. MBA uses transaction data to find frequent item pairs and validates associations with confidence metrics for actionable product recommendations.
What common pitfalls should be avoided in transaction data analysis?
Avoid arbitrary cohort definitions, anchor repeat rate windows to actual repurchase timing, and correct for data quality issues like duplicate transactions. Retention measurement breaks down when the repeat window is fixed arbitrarily rather than derived from real purchase behavior.
How do predictive models enhance transaction data analysis outcomes?
They forecast future customer behaviors and enable targeted marketing actions that improve retention and sharpen product offerings. Predictive layering on descriptive insights guides marketers on who to target and when for maximum campaign ROI.
Recommended
- Sales Data Analysis: Unlocking E-Commerce Growth - Affinsy Blog | Affinsy
- Order data analysis: Drive smarter e-commerce growth - Affinsy Blog | Affinsy
- How to Analyze Ecommerce Sales Data for Better Growth - Affinsy Blog | Affinsy
- Transaction data: boost sales, segment customers in 2026 - Affinsy Blog | Affinsy