
TL;DR:
- Most e-commerce brands fail to turn transaction data into actionable insights.
- RFM segmentation boosts revenue by targeting high-value customer groups effectively.
- Combining product analysis with cohort tracking and advanced mechanics enables smarter inventory and marketing decisions.
Most e-commerce brands sit on a goldmine of transaction data and never actually dig. They open a revenue dashboard, see total orders up 8%, and call it a Tuesday. But 73% of dashboards fail to close the gap between data collection and real business decisions. That gap is where your competitors are quietly gaining ground. This article covers three practical frameworks: segmenting customers with RFM, optimizing products through basket analysis, and setting up the technical mechanics that make it all reliable. Each framework pulls directly from transaction data you already have.
Table of Contents
- The real reason transaction data matters
- Customer segmentation: RFM unlocks actionable groups
- Product optimization: find bestsellers, bundles, and patterns
- Advanced mechanics: funnel tracking, cohorts, and edge cases
- Beyond dashboards: hard-won lessons and uncommon truths
- Take your transaction data analysis further with Affinsy
- Frequently asked questions
Key Takeaways
| Point | Details |
|---|---|
| Transaction data powers decisions | Analyzing purchase data reveals customer, product, and sales strategies you can’t see in simple revenue reports. |
| RFM segmentation drives targeting | Dividing customers by recency, frequency, and spend enables VIP campaigns, win-backs, and smarter retention tactics. |
| Product analytics optimize ROI | Spot top sellers, seasonal trends, and bundle opportunities to increase average order value and reduce margin erosion. |
| Benchmarking reveals growth levers | Key statistics like AOV and CAC help set actionable targets and evaluate performance against industry standards. |
| Technical setup and pitfalls matter | Clean, structured tracking is vital to avoid misleading data and truly unlock profit-driving insight. |
The real reason transaction data matters
Revenue numbers tell you what happened. They don’t tell you why it happened, which customers are worth fighting for, or which products are quietly bleeding margin. That’s the core difference between descriptive KPIs and leading analytics, and most e-commerce managers are stuck on the wrong side of it.
Descriptive KPIs like total revenue, units sold, and conversion rate are useful for reporting. But they’re backward-looking. Leading analytics, such as cohort retention, customer lifetime value (LTV), and repurchase probability, tell you where revenue is headed. Treating them the same is a costly mistake.
Here’s what gets missed when brands rely purely on revenue dashboards:
- Margin erosion: A product with high volume can have low or negative margin. Revenue analytics won’t show you this without layering in cost data.
- Inaccurate attribution: Last-click attribution overcredits search channels by 30 to 50%. If you’re allocating budget based on last-click, you’re likely underfunding the channels actually driving decisions.
- Ignored customer behaviors: Repeat purchase patterns, seasonal spikes, and early churn signals are all visible in transaction data. Most reporting setups never surface them.
Actionable dashboards connect raw transaction records to decisions. That means showing which customer segments are growing or shrinking, which products correlate with high LTV, and where funnel drop-offs create revenue leakage. When you master RFM analysis alongside product-level margin data, you stop reporting history and start managing the future.
“The best analytics teams don’t just build dashboards. They build decision systems.”
To get there, you need to move beyond tracking marketing KPI examples in isolation and start treating transaction data as a connected system. Every purchase event carries signals about who your customer is, what they value, and when they’re likely to return.
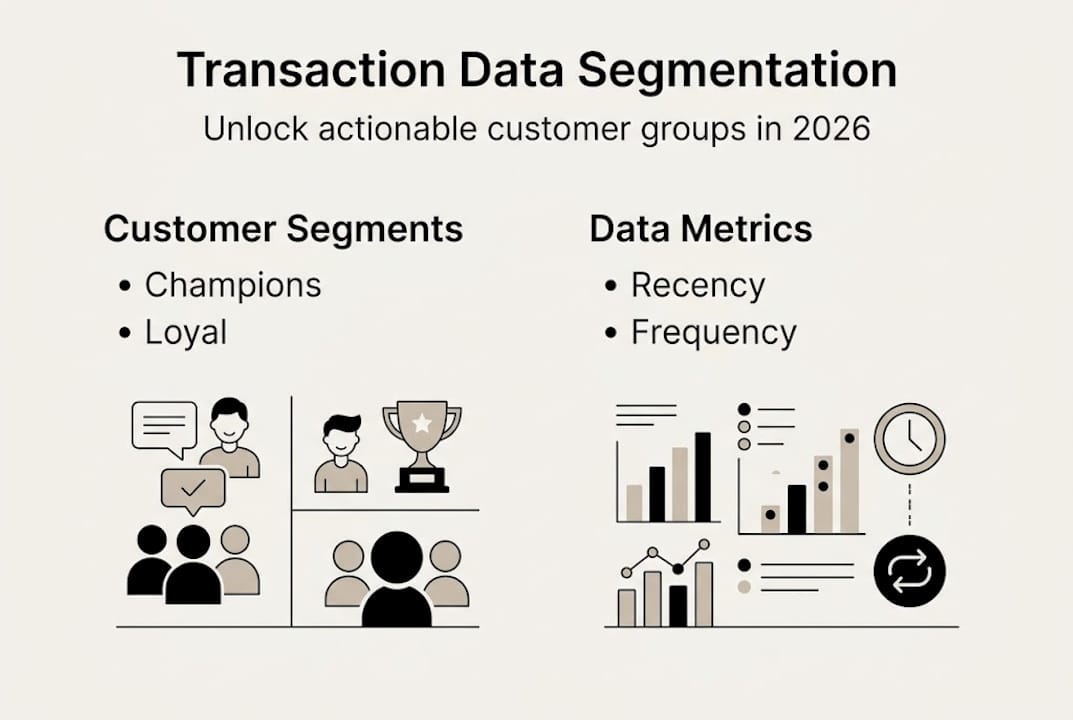
Customer segmentation: RFM unlocks actionable groups
RFM stands for Recency, Frequency, and Monetary value. It’s one of the most practical ways to turn raw transaction data into targeted customer groups. Each dimension gets scored from 1 to 5 using quintiles, meaning customers are ranked relative to each other rather than against fixed thresholds. That relative scoring is important, and we’ll come back to it.
Here’s how RFM segmentation translates into segments you can actually act on:
| Segment | RFM profile | Best action |
|---|---|---|
| Champions | 5-5-5 | VIP rewards, early access |
| Loyal customers | 4-4-x | Upsell, referral program |
| At risk | 2-4-x or 3-5-x | Win-back campaign |
| Low value | 1-1-1 | Suppress or nurture slowly |
The revenue impact here is significant. Brands using structured RFM analytics generate 3.7x more revenue per marketing dollar. That’s not from spending more. It’s from spending on the right people.
How to set up RFM scoring in practice:
- Export your order history with customer ID, order date, and order value. Any system from Shopify to Stripe produces this.
- Calculate each customer’s most recent purchase date (Recency), total number of orders (Frequency), and cumulative spend (Monetary).
- Rank customers into quintiles (1 to 5) for each dimension. Combine scores into a three-digit label like 5-4-3.
- Map combined scores to segments using a reference table. Champions cluster at high scores across all three; At Risk customers show declining recency with previously high frequency.
- Set up targeted campaigns per segment: VIP access for Champions, win-back sequences for at-risk revenue recovery, and churn prevention for customers whose recency score is dropping.
Pro Tip: Recalculate your RFM scores monthly, not quarterly. Customer behavior shifts fast, especially after promotional events. Also, enrich scores with behavioral data like browse history or email engagement to catch early churn signals that pure transaction data misses. The full Shopify RFM retention guide walks through this in detail.
One common pitfall: using fixed thresholds like “customers who spent over $200 are high value.” This breaks down across seasons and product categories. Quintile-based scoring adapts automatically to your actual customer distribution. Check the RFM analysis glossary for a clean breakdown of how each dimension works.
Product optimization: find bestsellers, bundles, and patterns
Once you’ve segmented your customers, the next question is: which products are actually driving profitable growth? Transaction data answers this directly, but you have to ask the right questions.

Volume and revenue tell different stories. A product with 1,200 units sold might generate less gross profit than one with 300 units but higher margin. Analyzing product performance by volume versus revenue side by side reveals which items deserve more marketing attention and which are costing you shelf space.
Seasonality matters just as much. Transaction data shows exactly when products peak. If a category spikes every October, you have a six-month runway to prepare inventory, set up targeted campaigns, and build bundle offers before demand hits.
Basket analysis is where product optimization gets genuinely interesting. By analyzing which products appear together in the same order, you can identify natural cross-sell pairings. These aren’t guesses; they’re statistically derived from your own purchase history. The cross-selling process built on basket analysis consistently outperforms manually curated recommendations because it reflects actual customer behavior.
Here are the benchmarks that matter when measuring product strategy impact:
| Metric | Global benchmark (2025) | Notes |
|---|---|---|
| Average order value (AOV) | $150 | Luxury: $328, Fashion: $72 |
| Customer acquisition cost (CAC) | $156 median | CAC should stay below 33% of 12-month LTV |
| Return on ad spend (ROAS) | 2.87:1 average | Category dependent |
Key product optimization moves driven by transaction data:
- Identify cross-sell bundles using co-purchase frequency. Products that appear together in 15%+ of orders are strong bundle candidates. See how basket analysis and bundling work in practice.
- Flag underperformers by comparing revenue rank versus margin rank. Items that rank high on revenue but low on margin need pricing or cost review.
- Use transactional insights to time promotions around natural demand peaks instead of gut feeling.
- Improve cross-selling execution by routing bundle recommendations to the right segments. Champions respond to premium bundles; At Risk customers respond to value offers. The guide on how to improve cross-selling strategies covers this in depth.
Pro Tip: Run ABC/Pareto analysis on profit, not just revenue. The top 20% of SKUs generating 80% of profit often differ from your top 20% by revenue. Managing inventory around the profit-first list protects margin during supply crunches.
Advanced mechanics: funnel tracking, cohorts, and edge cases
All the segmentation and product analysis above is only as good as the data feeding it. This section covers the technical setup that makes insights reliable rather than misleading.
Start with GA4 Enhanced eCommerce. GA4 funnel tracking with item-level parameters and deduplication via transaction_id gives you a clean, auditable purchase record. Without transaction_id deduplication, duplicate order events inflate revenue figures and distort cohort calculations.
Cohort analysis is the most underused mechanic in e-commerce analytics. Grouping customers by acquisition month and tracking their repurchase behavior over 6 to 12 months reveals your true LTV curve. It also shows whether a particular campaign brought in high-value repeat buyers or one-and-done discount hunters. Understanding customer purchase patterns through cohorts is far more revealing than aggregate retention rates.
Here’s a practical setup checklist:
- Confirm transaction_id is passed on every purchase event in GA4 to prevent duplicate counting.
- Tag acquisition source at the customer level, not just the session level, so cohorts can be filtered by channel.
- Build monthly cohort tables showing 30, 60, 90, and 180-day repurchase rates.
- Set alerts for anomalies in weekly transaction volume. Sudden spikes or drops usually signal a tracking issue, not a real business event.
Edge cases trip up even experienced teams:
- Product cycles vary dramatically. A mattress buyer won’t repurchase for years. A coffee subscriber might order every three weeks. Fixed RFM thresholds fail when applied across categories with different natural cycles.
- Data silos distort the full picture. If your returns data lives in a separate system and never merges with your order data, your revenue and LTV figures are both wrong.
- Post-event validation is mandatory. After peak events like BFCM, validate transaction data before running RFM or cohort analysis. Discount-driven buyers require separate treatment to avoid inflating your Champions segment with low-LTV customers.
For step-by-step cross-sell strategies built on clean cohort data, the sequencing of when to present offers matters as much as what you offer. And if you’re planning 2026 campaigns, reviewing cross-selling tips for 2026 alongside fresh cohort data gives you a genuinely data-driven playbook.
Beyond dashboards: hard-won lessons and uncommon truths
Most analytics guides stop at “build this dashboard” and call it done. Here’s the uncomfortable truth: dashboards don’t solve problems. Decisions do. The dashboard is just a trigger.
The trap most e-commerce managers fall into is optimizing for the metrics they can see rather than the outcomes they need. Revenue goes up, but margin quietly erodes. RFM scores look healthy, but you’re retaining the wrong customers because post-BFCM buyers inflated your segment counts.
RFM is inherently backward-looking. It tells you what a customer did, not what they’ll do next. That’s why combining it with ABC/Pareto analysis on profit rather than revenue creates a more complete picture. Operational capacity, not a rigid 80/20 rule, should set your product prioritization cutoffs. This is how you master RFM analysis and actually apply it.
The lesson we see repeatedly: brands segment for insight and never act. The segment exists in a spreadsheet. The campaign never launches. Build segmentation directly into your campaign workflow so that insight automatically becomes action.
Also, watch for “poison products.” These are items that attract high-volume, low-margin buyers who rarely return. They look great on a revenue dashboard and quietly kill profitability.
Take your transaction data analysis further with Affinsy
If you’ve made it this far, you understand that transaction data is not a reporting asset. It’s a decision-making system. The frameworks covered here, RFM segmentation, basket analysis, cohort tracking, and ABC/Pareto prioritization, are all executable with data you already have.

Affinsy is built to run exactly these analyses without requiring a data science team. Upload your order history via CSV, connect through API, or use MCP to pipe in data from any platform. From there, you get RFM segments, market basket analysis, and predictive analytics tools out of the box. WooCommerce users can start with the free order exporter plugin to get their data into the right shape. The free tier covers up to 20K line items with no credit card required.
Frequently asked questions
What is transaction data in e-commerce?
Transaction data refers to the details of each customer purchase, including items bought, order value, timing, and payment method. It reveals top products by volume versus revenue, seasonal patterns, and natural cross-sell pairings.
How does RFM analysis improve marketing ROI?
RFM scores customers on recency, frequency, and monetary value, letting you target high-value segments precisely. Brands with structured RFM analytics generate 3.7x more revenue per marketing dollar than those relying on broad campaigns.
Which key benchmarks can be revealed through transaction data?
Transaction data surfaces AOV, CAC, and ROAS at the product and channel level. Global AOV sits at $150 and median CAC at $156, with CAC recommended to stay below 33% of 12-month LTV.
What are the common pitfalls of transaction data analysis?
Fixed scoring thresholds, ignored product cycles, data silos, and duplicate records all distort insights. Clean data first and recalculate RFM scores weekly or monthly to keep segments accurate.
How can transaction data inform inventory decisions?
Combining RFM with ABC/Pareto on profit rather than revenue helps prioritize which SKUs deserve restocking investment, with operational capacity setting the real cutoffs instead of arbitrary percentages.
Recommended
- Why segment online customers to boost e-commerce sales - Affinsy Blog | Affinsy
- Customer segmentation explained: boost retention 2026 - Affinsy Blog | Affinsy
- Proven cross-selling tips to boost e-commerce sales in 2026 - Affinsy Blog | Affinsy
- AI Sales Optimization Strategies for E-commerce in 2026 - Affinsy Blog | Affinsy
- 7 data-gedreven sales voorbeelden voor slimme B2B groei