
TL;DR:
- Order data analysis reveals untapped insights about customer behavior and product performance that drive profitable growth.
- By exporting complete fields, applying segmentation and cohort frameworks, and tracking advanced metrics, brands can optimize retention and margins effectively.
Your order data is quietly holding a fortune in untapped insight. Most mid-to-large e-commerce brands pull a monthly revenue report, glance at average order value (AOV), and call it analysis. That habit costs real money. Every transaction your store processes carries signals about which customers will churn, which products pair naturally together, and which promotions quietly destroy your margins. Structured order data analysis turns those signals into actions, and this guide walks you through exactly how to do it, from the fields you need to export, to the frameworks that separate profitable growth from busy-work metrics.
Table of Contents
- What is order data analysis and why does it matter?
- The essential fields: What to capture in your order exports
- Deep dive: Segmentation, cohort analysis, and retention frameworks
- Advanced techniques: Time windows, repeat order metrics, and profit insights
- From analytics to action: Putting insights to work
- Why most order data analysis falls flat (and what actually works)
- Accelerate your growth with expert order data analysis tools
- Frequently asked questions
Key Takeaways
| Point | Details |
|---|---|
| Order data is strategic | Analyzing order-level data reveals patterns to drive both sales and retention. |
| Capture all key fields | Accurate exports should include IDs, dates, customer info, products, pricing, discounts, shipping, and more. |
| Use segmentation and cohorts | Combine RFM segmentation and cohort analysis for actionable growth opportunities. |
| Measure profit, not just sales | Distinguish high-volume from high-margin customers by factoring in discounts and shipping. |
| Turn insights into action | Deploy targeted campaigns, offers, and product strategies based on your order data findings. |
What is order data analysis and why does it matter?
Order data analysis is the in-depth study of individual sales transactions to understand revenue performance, customer behavior, and product dynamics. It goes far beyond counting sales. You’re looking at patterns: who bought what, when they came back, what discount they used, and whether the shipping cost made that order profitable in the first place.
The strategic value is hard to overstate. When you practice analyzing ecommerce sales data systematically, you gain a living picture of your business that no dashboard summary can replicate. You can track revenue trends, measure AOV shifts, evaluate the margin impact of promotions, and identify the early warning signs of customer churn, all from the same data source.
Here’s what solid order data analysis enables:
- Revenue intelligence: Identify which product categories drive real margin, not just volume.
- Retention signals: Spot customers who are drifting before they actually leave.
- Marketing precision: Allocate budget to customer segments with the highest lifetime value.
- Product strategy: Discover which items pull repeat purchases and which ones are one-and-done.
- Discount accountability: See exactly how promotional codes affect net profitability.
A key point that sales data analysis tips reinforce repeatedly: the brands that grow fastest treat their order exports as a strategic asset, not an accounting output.
“Order exports enable analysis beyond spreadsheets: aggregate order-level metrics, run time-series decomposition to separate trend, seasonality, and noise, and apply significance and multivariate comparisons to identify what truly changed.”
That kind of rigor is what separates brands growing at 30% year-over-year from those stuck at flat.
The essential fields: What to capture in your order exports
You can’t analyze what you didn’t capture. Before running any framework, you need a clean, complete export. The core fields for order analysis cover order ID, order date, customer identifier, line items and quantities, discounts, shipping costs, taxes, and order totals. Each field unlocks a specific type of insight.
Here’s a reference table showing common export fields and what each one powers:
| Field | Example value | Analysis it enables |
|---|---|---|
| Order ID | #10045 | Deduplication, join key |
| Order date | 2026-03-15 | Time series, cohort start |
| Customer ID / email | user@domain.com | Repeat purchase rate, RFM |
| Product / variant | Blue Sneaker / Size 10 | Basket analysis, product mix |
| Quantity | 2 | Volume vs. revenue split |
| Unit price | $89.00 | AOV, margin calculation |
| Discount code | SPRING20 | Promotion ROI, dependency rate |
| Shipping cost | $7.50 | True profitability per order |
| Tax | $6.23 | Net revenue accuracy |
| Order total | $171.23 | Revenue reporting, CLV |
The numbered checklist for a minimum viable export:
- Order ID and order date (the backbone of every time-based analysis)
- Customer identifier, either a unique ID or hashed email
- Product name, SKU, and variant (critical for market basket work)
- Quantity and unit price
- Discount code and discount amount
- Shipping fee charged and shipping cost to the business if available
- Tax and order total
Pro Tip: Always include discount code and shipping cost columns in your export, even for orders where neither applies. Blank cells are perfectly valid. Missing columns mean you can’t run margin or discount-dependency analyses later, and rebuilding exports retroactively is painful.
The goal with essential data fields for exports is completeness up front. A five-minute export decision today prevents hours of data cleaning later.
Deep dive: Segmentation, cohort analysis, and retention frameworks
Raw order fields become powerful when you apply the right frameworks. Two methods stand above the rest for e-commerce: RFM segmentation and cohort analysis. Use them together and you get a 360-degree view of your customer base.
RFM segmentation scores each customer on three axes:
- Recency ®: How recently did they last purchase? A customer who bought last week scores higher than one who bought eight months ago.
- Frequency (F): How often do they buy? One-time buyers are very different from monthly repeat customers.
- Monetary (M): How much do they spend in total? This is not just AOV but cumulative lifetime spend.
For RFM segmentation, you score each customer 1 to 5 on each axis (or 1 to 3 for simpler models), then combine scores into lifecycle groups. The most actionable customer lifecycle groups include:
- Champions: High R, F, and M. Your best customers. Reward them.
- Loyal customers: High F but slightly lower recent activity. Deepen the relationship.
- At-risk: Used to buy often but haven’t recently. Win-back candidates.
- Lost: Low across all three scores. Recovery is possible but expensive.
- New customers: First purchase is recent, frequency not yet established.
Cohort analysis works differently. Instead of scoring individual customers, you group all buyers who made their first purchase in the same calendar month. Then you track what percentage of each cohort returns in month 2, month 3, month 6, and beyond. This is a core methodology because it reveals retention dynamics that blended dashboards hide completely. A cohort from a big sale month may show 40% lower retention at 90 days than an organic cohort, signaling that discount-acquired customers don’t stick.
Klaviyo’s research positions these two approaches as complementary, not competing. Use RFM for segment-level messaging right now. Use cohort analysis to understand how retention evolves over months and whether your acquisition channels are bringing in durable customers.
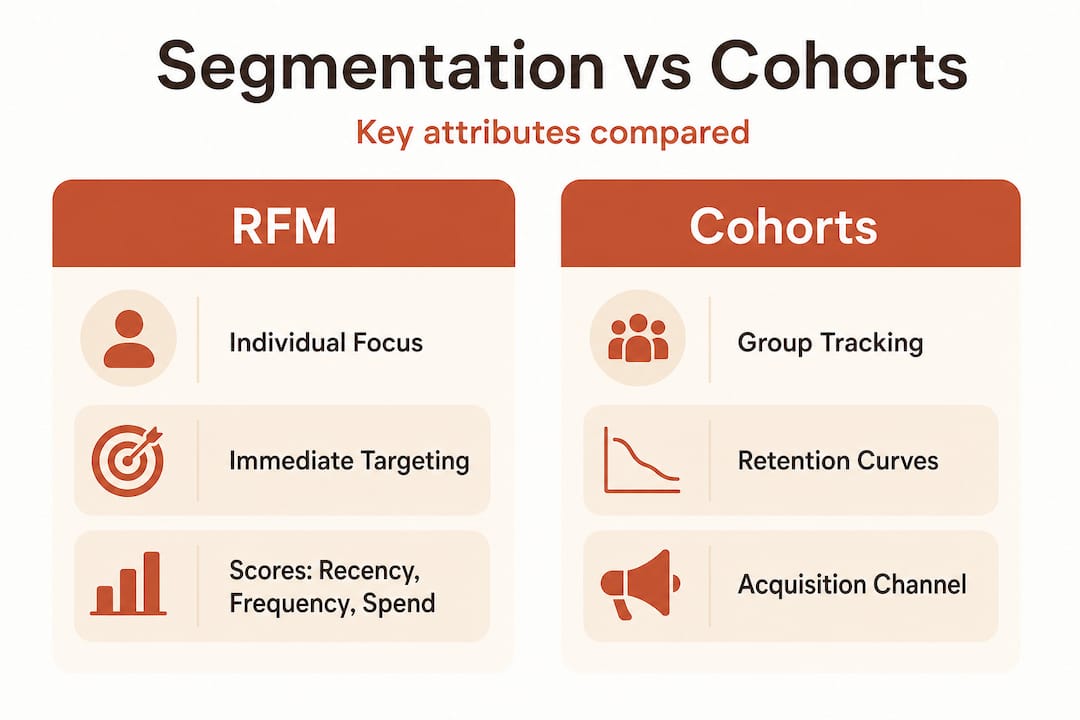
Here’s a direct comparison to clarify when to use each:
| Attribute | RFM segmentation | Cohort analysis |
|---|---|---|
| Unit of analysis | Individual customer | Group by acquisition month |
| Time focus | Snapshot (now) | Longitudinal (over time) |
| Best for | Targeting campaigns today | Evaluating retention trends |
| Output | Segment labels | Retention curves |
| Action example | Win-back email to at-risk | Adjust acquisition spend by cohort quality |
For a deeper walkthrough of customer cohort insights and how to build retention curves from your own data, the resources are available to get you started immediately.
Pro Tip: Don’t choose between RFM and cohort analysis. Run both monthly. Segmentation tells you who to message today. Cohorting tells you whether your customer base is getting healthier or quietly eroding.
You can also connect these frameworks back to mastering RFM analysis for e-commerce and to analyzing customer patterns to see how product-level purchase sequences reinforce segment behavior.
Advanced techniques: Time windows, repeat order metrics, and profit insights
Once you have segmentation and cohort frameworks in place, you’re ready for the metrics that separate good analysts from great ones. The mistake most stores make is relying on a single blended repeat purchase rate, something like “28% of customers reorder.” That number masks everything that matters.

Instead, break retention into time windows. Structured time-window analysis at 30, 60, and 90 days shows you where drop-off actually happens. If 18% of customers reorder within 30 days but the number barely budges at 60 days, your 60-day email sequence is broken, not your product. That’s an actionable finding. A blended rate gives you nothing to fix.
Here are the advanced metrics worth tracking, ranked by business impact:
- Median days to second order: The typical repurchase cycle for your category. This tells you exactly when to trigger post-purchase sequences.
- 30/60/90-day retention by cohort: Reveals where customers drop off in the funnel.
- Repeat order AOV index: Do repeat buyers spend more or less per order than first-time buyers? A ratio below 1.0 means loyalty programs may be training customers to wait for discounts.
- Discount dependency rate: What percentage of repeat orders used a discount code? High rates signal margin risk, not loyalty.
- Net margin per customer segment: Subtract shipping costs and discounts from revenue. Champions who always use a 20% code may be less profitable than loyal customers who pay full price.
- Return rate by segment: High-volume customers with high return rates can flip from asset to liability quickly.
“Profitability depends on separating volume leaders from margin leaders and accounting for discount and return and shipping effects rather than using revenue alone.”
This is where behavior-based retention analysis pays off. A customer segment that appears to be your best by order count may be net-negative once you factor in the cost of free returns and stacked discount codes. Knowing this changes your entire retention investment strategy.
From analytics to action: Putting insights to work
Frameworks and metrics only matter when they drive decisions. The real goal of order data analysis is to change what you do, not just what you know.
Here’s how each segment maps to specific actions:
- Champions: Offer early access, exclusive products, or a referral incentive. They’re your most effective brand advocates.
- At-risk customers: Trigger a win-back sequence timed to their median repurchase window, not a generic 90-day delay. Include a personalized product recommendation based on their purchase history.
- Loyal customers: Cross-sell adjacent categories. Their frequency tells you they trust the brand. Use that trust to introduce higher-margin product lines.
- Lost customers: A reactivation offer can work, but focus on learning first. A short feedback survey from lost customers surfaces product or experience problems you may not know exist.
- New customers: The second purchase is the most critical conversion in e-commerce. A strong post-purchase sequence in the first 30 days dramatically improves long-term retention.
Shopify’s research on order history reinforces that marketers who use purchase history for dynamic segmentation run more relevant campaigns and see higher engagement than those sending broadcast messages to blended lists.
Pro Tip: Never send the same promotion to your whole list. Segment by at least three groups: new buyers (within 60 days), active repeat buyers, and at-risk customers. Each group needs a different message, a different offer, and a different urgency signal.
Product bundling and customer loyalty strategies should also align to segment behavior. Don’t offer a bundle discount to a champion who already buys multiple items willingly. Save the bundle incentive for customers who are stuck in single-category purchasing and need a nudge to expand.
Why most order data analysis falls flat (and what actually works)
Here’s the uncomfortable truth: most e-commerce teams run analysis that confirms what they already believe. They look at total revenue up or down, AOV up or down, and stop there. That’s not analysis. That’s bookkeeping with charts.
The biggest missed opportunity we see consistently is the failure to combine margin data with segmentation. A brand’s “top 10% of customers by revenue” almost always includes a meaningful cluster of high-discount, high-return buyers whose net contribution is close to zero. Treating them the same as true high-value customers wastes budget and inflates acquisition cost benchmarks.
The contrarian take worth sitting with: churn risk is actually less important than expected next order date. Most retention programs are built around fear of loss rather than proactive timing. If your analysis tells you a customer’s median repurchase cycle is 45 days and you send a win-back email on day 60, you’ve already missed the window. Building campaigns around predicted next order date is far more effective than reacting to absence.
The sales data analysis benefits that compound over time come from treating analysis as iterative. Run your RFM model, act on it, measure the results, and refine the segment definitions. Cohort retention curves from six months ago should inform how you evaluate current acquisition channels. This is a loop, not a report.
The brands that extract the most value from their order data are not the ones with the fanciest tools. They’re the ones who revisit their analysis regularly, challenge their assumptions, and keep asking: which customers actually grew our business, and what did they have in common?
Accelerate your growth with expert order data analysis tools
Understanding the frameworks is step one. Putting them to work at scale is where growth actually happens.

Affinsy was built specifically for e-commerce brands who want to go from raw order exports to actionable RFM segments and market basket insights without needing a data science team. Whether you connect via API, CSV upload, or MCP, the platform analyzes your transaction history and surfaces the patterns that matter most. If you want to explore the concepts behind the platform, the predictive analytics glossary and customer segmentation overview are solid starting points. WooCommerce store owners can grab the free order exporter plugin to pull clean exports instantly. The permanent free tier covers up to 20K line items with no credit card required. Start analyzing today and see exactly where your growth is hiding.
Frequently asked questions
What is the minimum data required for effective order data analysis?
You’ll need order ID, date, customer info, product details, pricing, discounts, shipping, taxes, and totals for baseline analysis. These fields together support revenue tracking, AOV, cohort analysis, and customer segmentation.
How can cohort analysis improve my retention strategy?
Cohort analysis tracks groups of customers over time, showing where retention drops and which acquisition channels deliver durable buyers. That clarity lets you fix the right thing in your retention funnel.
What’s the difference between RFM segmentation and cohort analysis?
RFM scores individual customers on recency, frequency, and spend for immediate targeting, while cohort and segmentation approaches complement each other by mapping repeat purchase trends over time rather than at a single point.
How often should order data analysis be performed?
Monthly analysis is the standard baseline for most brands, but high-volume stores benefit from weekly reviews to catch trend shifts and respond to campaign performance in near real-time.
Can order data analysis help increase profitability, not just sales?
Absolutely. Tracking discount and shipping economics alongside revenue exposes which segments are genuinely profitable and which ones look strong on volume but erode margin through discounts, returns, and fulfillment costs.
Recommended
- Sales Data Analysis: Unlocking E-Commerce Growth - Affinsy Blog | Affinsy
- Data-Driven Ecommerce Strategies for Smarter Growth - Affinsy Blog | Affinsy
- How to Analyze Sales Data for Smarter E-Commerce Growth - Affinsy Blog | Affinsy
- E-commerce Data Analysis Tutorial: Boost Sales with Insights - Affinsy Blog | Affinsy