
Most e-commerce businesses collect mountains of customer data but struggle to transform it into loyalty strategies that actually work. You track purchases, clicks, and cart activity, yet your repeat purchase rates remain flat and churn continues to climb. The disconnect isn’t your effort or intent. It’s that raw data without proper analytics is like owning a map without knowing how to read it. Understanding how to leverage analytics for customer segmentation, churn prediction, and lifetime value optimization can turn your loyalty program from a cost center into a profit engine. This guide will show you exactly how to use RFM segmentation, predictive modeling, and key metrics to build loyalty strategies that deliver measurable ROI.
Table of Contents
- Key takeaways
- Understanding customer segmentation with RFM analysis
- Harnessing predictive analytics to reduce churn and increase CLV
- Key metrics to measure loyalty program effectiveness
- Putting analytics into action: practical tips and case examples
- Enhance your loyalty strategy with Affinsy’s analytics tools
- What is RFM analysis and why is it important for loyalty?
- How can predictive analytics reduce customer churn?
- What key metrics should I track to measure loyalty program success?
- How do I get started with loyalty analytics if I have limited data?
Key Takeaways
| Point | Details |
|---|---|
| RFM segmentation foundations | RFM analysis groups customers by recency, frequency, and monetary value to target loyalty efforts with precision. |
| Predictive churn reduction | Predictive churn models with between eighty five and ninety two percent accuracy can reduce churn by fifteen to twenty five percent, enabling targeted retention campaigns before customers leave. |
| CLV driven investment | Lifetime value modeling estimates the total revenue from a customer over their relationship, justifying larger investments in high value segments. |
| Loyalty ROI measurement | Measuring metrics like CLV and redemption rates demonstrates loyalty program ROI and guides smarter decision making. |
Understanding customer segmentation with RFM analysis
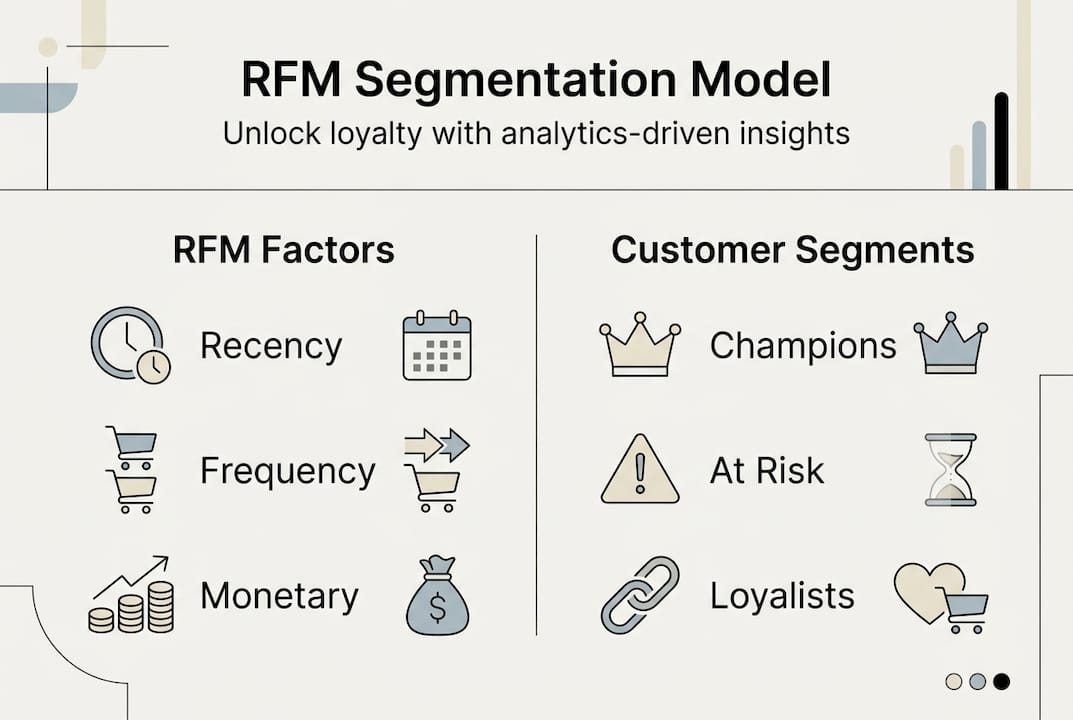
RFM analysis stands for Recency, Frequency, Monetary value. It’s the foundation of effective loyalty analytics because it groups customers based on actual purchase behavior rather than demographics or guesswork. When you know who bought recently, who buys often, and who spends the most, you can target loyalty efforts with surgical precision instead of spraying discounts everywhere and hoping something sticks.
The RFM model segments customers into Champions, Loyalists, At Risk with 85-92% predictive accuracy, making it one of the most reliable tools for retention strategy. Champions are your top customers who bought recently, buy frequently, and spend heavily. Loyalists purchase regularly but may spend less per transaction. At Risk customers once bought frequently but haven’t returned in a while. Each segment demands different tactics.
| RFM Score Range | Segment | Characteristics | Loyalty Action |
|---|---|---|---|
| R5 F5 M5 | Champions | Recent, frequent, high-value buyers | VIP perks, early access, referral incentives |
| R4-5 F3-4 M3-4 | Loyalists | Consistent mid-tier customers | Reward consistency, upsell opportunities |
| R1-2 F4-5 M4-5 | At Risk | Previously valuable, now dormant | Win-back campaigns, special offers |
| R1-2 F1-2 M1-2 | Hibernating | Long inactive, low engagement | Re-engagement or sunset strategies |
Targeting dormant customers with master RFM analysis for e-commerce sales strategies yields impressive results because these customers already know your brand. They don’t need awareness campaigns. They need a compelling reason to return. A personalized win-back offer based on their past purchase patterns converts far better than generic promotions.
Benefits of RFM segmentation for loyalty programs:
- Reduces wasted marketing spend by focusing resources on segments most likely to respond
- Identifies which customers drive the most revenue so you can protect those relationships
- Spots at-risk customers early enough to intervene before they churn completely
- Enables personalized messaging that resonates with each segment’s behavior patterns
- Provides clear benchmarks for measuring segment movement over time
Pro Tip: Combine RFM scores with customer feedback surveys to understand the emotional drivers behind purchase patterns. A Champion who rates satisfaction low may be one bad experience away from leaving, while a Loyalist with high satisfaction scores represents untapped upsell potential.
Harnessing predictive analytics to reduce churn and increase CLV
Predictive analytics takes historical data and uses machine learning algorithms to forecast future behavior. Instead of reacting to churn after customers leave, you identify warning signs weeks or months in advance. Predictive churn models deliver 85-92% accuracy and can reduce churn 15-25%, giving you time to deploy targeted retention campaigns before it’s too late.
Customer lifetime value modeling works similarly. It calculates the total revenue you can expect from a customer over their entire relationship with your brand. When you know a segment’s average CLV is $2,400 versus $380, you can justify spending more to acquire and retain the high-value group. This transforms loyalty from a feel-good initiative into a strategic investment with measurable returns.
“Increasing customer retention rates by just 5% can boost profits by 25% to 95%. Predictive analytics makes this possible by identifying exactly where to focus retention efforts for maximum impact.” - Frederick Reichheld, Loyalty Expert
Key benefits of behavioral analytics churn prediction include:
- Early warning system flags customers showing pre-churn behaviors like declining purchase frequency
- Automated triggers send personalized retention offers at optimal moments
- Resource allocation improves by focusing on savable customers rather than lost causes
- Testing and optimization become data-driven instead of guesswork
- CLV forecasts enable smarter acquisition spending and loyalty budget planning
Implementing predictive models requires these steps:
- Centralize customer data from all touchpoints into a unified analytics platform
- Define churn clearly for your business model (30 days inactive, 90 days, 6 months)
- Train models on historical data including both churned and retained customer patterns
- Validate model accuracy with holdout data before deploying to production
- Integrate predictions into marketing automation for real-time intervention
- Monitor model performance and retrain quarterly as customer behavior evolves
Pro Tip: Layer predictive analytics with customer service data. Customers who contact support frequently but receive slow responses show elevated churn risk even if purchase patterns look normal. Combining behavioral and interaction data creates more nuanced predictions.
Key metrics to measure loyalty program effectiveness
Tracking the right metrics separates successful loyalty programs from expensive failures. Vanity metrics like total program members sound impressive but reveal nothing about profitability or engagement. Focus instead on metrics that directly tie to revenue and customer behavior.
Essential loyalty program metrics:
| Metric | Definition | Benchmark Range | Why It Matters |
|---|---|---|---|
| Participation Rate | % of customers enrolled in program | 15-40% | Shows program appeal and awareness |
| Redemption Rate | % of earned rewards actually redeemed | 20-40% | Indicates perceived value of rewards |
| Repeat Purchase Rate | % of customers making 2+ purchases | 25-40% | Core loyalty indicator |
| AOV Uplift | Average order value: members vs non-members | 15-30% higher | Measures member spending behavior |
| Net Promoter Score | Likelihood to recommend (scale -100 to +100) | 30-50+ | Predicts word-of-mouth growth |
| Customer Lifetime Value | Total revenue per customer over relationship | Varies by industry | Justifies retention investment |
| Program ROI | Revenue generated vs program costs | 3-10x return | Proves financial viability |
Loyalty programs achieve 3-10x ROI when properly measured and optimized. The key is tracking these metrics monthly and comparing cohorts. Are customers who joined your program in January showing better retention in month six than those who joined in February? That insight tells you if program changes are working.
Steps to collect and analyze loyalty metrics effectively:
- Integrate loyalty platform data with e-commerce analytics and CRM systems
- Establish baseline metrics before launching new program features or campaigns
- Create cohort reports comparing member behavior to non-members over time
- Track redemption patterns to identify which rewards drive the most engagement
- Calculate incremental revenue by comparing member spending to control groups
- Survey members quarterly to understand satisfaction and identify improvement areas
- Review 5 metrics that predict sales success to align loyalty KPIs with broader business goals
Avoid the trap of celebrating high enrollment numbers while ignoring low engagement. A program with 10,000 members but only 8% active participants performs worse than one with 2,000 members and 45% engagement. Quality beats quantity every time in loyalty analytics.
Understanding top retail analytics terms helps you communicate metrics effectively across your organization. When everyone speaks the same data language, you can make faster decisions and align teams around common goals.
Putting analytics into action: practical tips and case examples
Theory means nothing without execution. Here’s how to implement analytics-driven loyalty strategies step by step:
- Start with data audit: Identify all customer touchpoints and ensure data flows into a central analytics system
- Implement RFM segmentation: Use existing transaction data to create initial customer segments
- Deploy churn prediction: Build or buy predictive models trained on your historical customer data
- Design segment-specific campaigns: Create targeted messaging and offers for each customer group
- Test and measure: Run A/B tests comparing analytics-driven approaches to control groups
- Automate workflows: Connect predictions to marketing automation for real-time interventions
- Review and optimize: Analyze results monthly and refine segmentation rules and campaign tactics
Analytics-driven loyalty yielded 307% LTV growth, 52% response rates, and discount reduction in documented cases. These results came from retailers who moved beyond gut-feel loyalty tactics to data-driven strategies.
| Company Type | Analytics Approach | Key Results |
|---|---|---|
| Fashion DTC Brand | RFM segmentation + personalized win-back | 307% increase in customer LTV, 52% email response rate |
| Home Goods Retailer | Predictive churn modeling + tiered rewards | 23% churn reduction, 18% AOV increase among members |
| Beauty E-commerce | CLV-based acquisition + VIP program | 4.2x program ROI, 35% repeat purchase rate improvement |
Pro Tip: Distinguish seasonal shopping patterns from true churn in your analytics for D2C retention strategy. A customer who buys winter gear annually isn’t churned in July. Adjust your churn definition by product category to avoid false alarms.
Small e-commerce stores with limited historical data can still benefit from analytics. Start with basic RFM segmentation using just six months of transaction data. As you collect more information, your models improve. The key is starting now rather than waiting for perfect data conditions that never arrive.

Data-driven decision making in retail extends beyond loyalty to inventory, pricing, and merchandising. When you centralize customer insights, you can optimize the entire shopping experience. Customers who receive relevant product recommendations based on purchase history show higher satisfaction and lifetime value.
Combining loyalty analytics with retail analytics that boost bundling and AOV creates powerful cross-selling opportunities. When you know which products Champions buy together, you can create bundles that appeal to Loyalists moving up the value ladder.
Enhance your loyalty strategy with Affinsy’s analytics tools
Transforming customer data into loyalty growth requires the right analytics infrastructure. Affinsy’s AI-powered platform analyzes your historical transaction data to uncover hidden patterns in customer behavior and product relationships. You get actionable customer segmentation insights, predictive analytics for churn prevention, and automated reporting that tracks the metrics that matter.

The platform integrates seamlessly with Shopify, WooCommerce, and Google Analytics, so you can start analyzing immediately without complex data migrations. Market basket analysis reveals which products your best customers buy together, enabling smarter bundling and cross-sell strategies. Custom dashboards let you monitor RFM segments, CLV trends, and program ROI in real time. Explore how Affinsy can turn your customer data into loyalty program growth.
What is RFM analysis and why is it important for loyalty?
RFM stands for Recency, Frequency, Monetary value. It segments customers based on when they last purchased, how often they buy, and how much they spend. This behavioral segmentation identifies your most valuable customers and those at risk of churning. RFM matters for loyalty because it enables targeted interventions rather than one-size-fits-all campaigns. You can reward Champions differently than you re-engage At Risk customers. Learn more about mastering RFM analysis for e-commerce sales to implement this powerful segmentation method.
How can predictive analytics reduce customer churn?
Predictive analytics uses historical purchase patterns, browsing behavior, and engagement data to forecast which customers are likely to churn. Machine learning models identify warning signs like declining purchase frequency or reduced site visits weeks before customers stop buying completely. This early warning system lets you deploy targeted retention campaigns, personalized offers, or proactive outreach to save at-risk relationships. Studies show predictive approaches can reduce churn by 15-25% compared to reactive strategies. Explore behavioral analytics for churn prediction to see how this works in practice.
What key metrics should I track to measure loyalty program success?
Track customer lifetime value, repeat purchase rate, program ROI, redemption rate, and Net Promoter Score as your core loyalty metrics. CLV shows the total revenue impact of retaining customers. Repeat purchase rate indicates how well your program drives ongoing engagement. Program ROI proves financial viability by comparing revenue generated to program costs. Redemption rate reveals whether customers find your rewards valuable enough to claim. NPS predicts word-of-mouth growth from satisfied members. Together, these metrics provide a complete picture of loyalty program health. Read more about optimizing e-commerce retention for lasting growth to implement comprehensive tracking.
How do I get started with loyalty analytics if I have limited data?
Start with basic RFM segmentation using just three to six months of transaction history. Even limited data reveals patterns in customer behavior that you can act on immediately. Focus on identifying your top 20% of customers and your at-risk segment first. As you collect more data over time, your segmentation accuracy improves and you can layer in predictive models. The key is beginning with simple analytics now rather than waiting for perfect data conditions. Many successful loyalty programs started with basic segmentation and evolved into sophisticated predictive systems over 12 to 18 months.
Recommended
- How to optimize e-commerce retention for lasting growth - Affinsy Blog | Affinsy
- Customer Insights Analytics Guide: Unlocking Value in 2025 - Affinsy Blog | Affinsy
- Role of Analytics in D2C: Maximizing Retention and Sales - Affinsy Blog | Affinsy
- Retail analytics boost bundling AOV 50% in 2026 - Affinsy Blog | Affinsy
- Uman