
TL;DR:
- Most eCommerce teams lack actionable dashboards due to fragmented data and reliance on intuition.
- Building structured analytics processes and automating insights significantly boosts revenue and retention.
- Overcoming data silos and shifting from descriptive to prescriptive analytics enable optimized product bundling and targeted marketing.
Despite sitting on mountains of transaction data, 73% of eCommerce teams lack dashboards that actually tell them what to do next. That gap is not a technology problem. It is a strategy problem. Most teams collect data faithfully, run reports weekly, and still make bundling and retention decisions based on gut feel. This article walks you through what actionable insights really are, how market basket analysis and RFM segmentation convert raw transaction data into revenue decisions, and how to remove the barriers standing between your data and your bottom line.
Table of Contents
- What actionable insights are and why they matter
- From data overload to revenue decisions: How insights drive bundling and retention
- Customer segmentation: Powering targeted retention with actionable analytics
- Overcoming common obstacles: Data silos, intuition traps, and tactical solutions
- Why most e-commerce teams get actionable insights wrong (and what actually works)
- Take your insights from analysis to action
- Frequently asked questions
Key Takeaways
| Point | Details |
|---|---|
| Actionable insights drive revenue | Teams using actionable analytics make profitable decisions about bundling and retention. |
| Predictive strategies outperform intuition | Structured analytics yield 3.7x more revenue than decisions based only on intuition. |
| Bundling boosts retention | Personalized product bundles can increase customer retention rates by up to 40 percent. |
| Segment and target for best ROI | Using RFM and cohort analysis together helps prioritize high-value customer win-back campaigns. |
What actionable insights are and why they matter
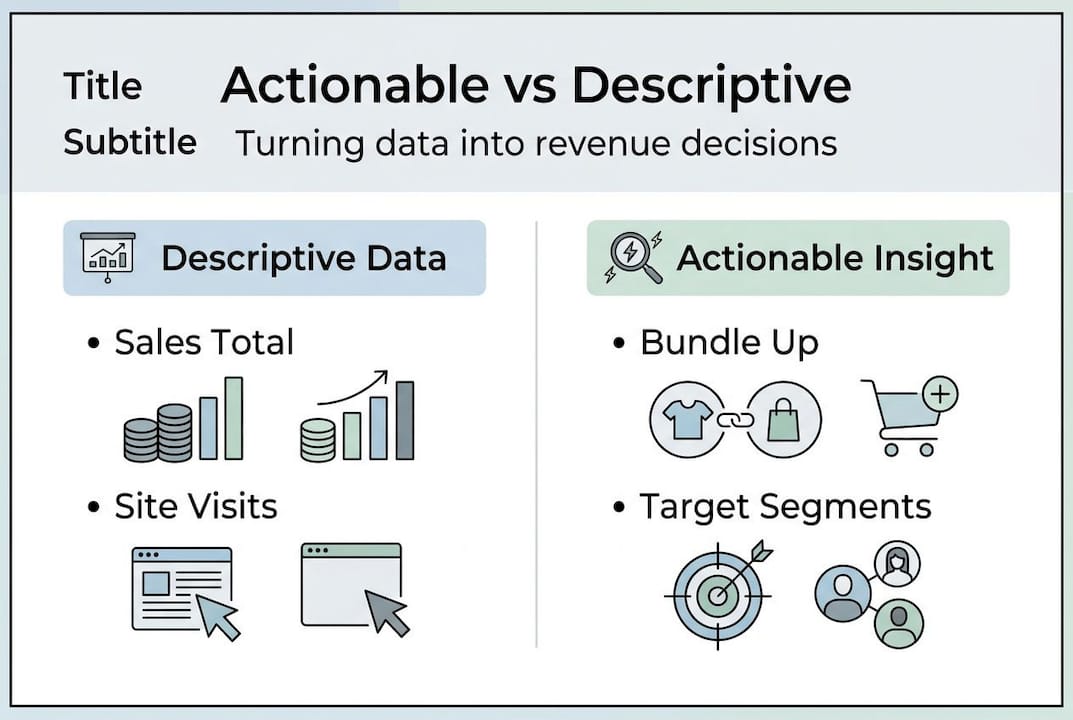
Most analytics conversations start and end with descriptive data: total revenue, sessions, conversion rate, average order value. These numbers tell you what happened. They do not tell you what to do about it. That distinction is where most e-commerce teams get stuck.
Descriptive analytics shows what happened, but actionable insights require diagnostic, predictive, and prescriptive layers to recommend what to do. Think of it as four floors in a building. The ground floor shows your sales report. The next floor explains why a metric changed. The third floor predicts what will happen next. The top floor tells you exactly which lever to pull. Most teams live on the ground floor.
The operational impact of climbing those floors is significant. Teams that build structured analytics processes like weekly KPI monitoring generate 3.7x more revenue per marketing dollar than teams relying on intuition. That is not a marginal improvement. It is the difference between a brand that grows and one that plateaus.
For actionable ecommerce insights to actually work, they need to meet a few specific criteria:
- Specific: Points to a defined product, segment, or campaign rather than a vague trend
- Timely: Delivered when action is still possible, not in a retrospective quarterly review
- Measurable: Tied to a metric that will move if the right action is taken
- Assigned: Clear about who on your team is responsible for acting on it
- Connected to revenue: Directly linked to AOV, retention rate, or lifetime value
“The goal is not more data. The goal is fewer decisions made without evidence.”
Understanding the analytics role in platforms like WooCommerce makes it clear why native reporting tools often fall short. They handle the ground floor well. Getting to the prescriptive level requires dedicated analytics logic built around your specific transaction patterns. That is where purpose-built tools change the outcome.
If you want to skip the manual work entirely, it is worth exploring how you can automate retail analytics to surface these insights on a schedule instead of waiting for someone to run a report.
From data overload to revenue decisions: How insights drive bundling and retention
Knowing what actionable insights are is one thing. Applying them to product bundling is where the real revenue lift happens.

Product bundling increases average order value by 20 to 30% and conversions by 15 to 25%, with personalized bundles driving 40% higher retention. Those numbers shift dramatically depending on whether your bundles are based on gut feel or actual purchase pattern data.
Market basket analysis is the engine behind data-driven bundling. It scans your transaction history to find products that customers consistently buy together. A lift score above 1.3 signals a strong product association worth testing as a formal bundle. You can also see real-world examples of bundles across categories to understand how these patterns translate into offers.
Here is a direct comparison of what changes when you move from traditional to data-driven bundling:
| Metric | Traditional bundling | Data-driven bundling |
|---|---|---|
| Conversion rate | 8 to 12% | 18 to 25% |
| Average order value | Baseline | +20 to 30% |
| Repeat purchase rate | Baseline | +40% with personalization |
| Bundle selection method | Intuition or manual review | Market basket lift scores |
If you are ready to improve average order value through structured bundling, here is a practical sequence to follow:
- Export your full order history and run market basket analysis to surface high-lift product pairs
- Filter results to pairs with lift above 1.3 and a confidence score above 0.2
- Group qualifying pairs into bundle tiers: complementary, value, and premium
- A/B test bundles against individual product pages for 30 days before scaling
- Monitor AOV and repeat purchase rate by bundle type, not just total sales
The key insight most teams miss is that bundling strategies for ecommerce are not just about increasing the size of a single transaction. When a customer buys a bundle, they engage with more of your product catalog. That broader engagement is what drives the 40% retention lift. Bundling is a retention strategy disguised as a revenue tactic.
Customer segmentation: Powering targeted retention with actionable analytics
Bundling drives the first sale. Segmentation determines whether customers come back.
RFM segmentation (Recency, Frequency, Monetary) identifies high-LTV customers by analyzing transaction history across three dimensions, and it can predict 12 to 24 month customer value from data you already own. It is one of the fastest ways to stop treating your entire customer list as one audience.
Here is what realistic RFM segment performance looks like for a mid-size e-commerce brand:
| RFM segment | Description | Expected 90-day repeat rate |
|---|---|---|
| Champions | Bought recently, buy often, spend most | 60 to 75% |
| Loyal customers | Regular buyers, moderate spend | 40 to 55% |
| At-risk | High spend history, not buying recently | 15 to 25% |
| Lost | Low recency, low frequency, low spend | Under 10% |
A healthy 90-day repeat purchase rate sits above 20%, and sustainable businesses generate 40 to 60% of revenue from returning customers. If your numbers fall short, RFM analysis usually reveals exactly which segment is leaking.
Cohort analysis adds another layer. It groups customers by the month they first purchased and tracks their behavior over time. This reveals hidden retention issues where strong new customer acquisition masks a declining repeat rate in older cohorts. You can appear to be growing while your loyal customer base quietly erodes. You can also explore churn analysis methods to pair with RFM for a complete retention picture.
When you combine RFM and cohort analysis for a win-back strategy, the approach looks like this:
- Identify at-risk customers (high Monetary, low Recency) from RFM output
- Cross-reference with cohort data to confirm the drop-off period
- Build channel-specific win-back campaigns matched to each segment’s last purchase category
- Measure success by 60-day repeat rate, not just open rates or clicks
Pro Tip: At-risk customers with high Monetary scores respond significantly better to channel-specific campaigns (SMS or direct mail) than to generic email blasts. Use your RFM data to match the channel to the customer’s historical engagement pattern.
For practical application, the RFM segmentation win-back playbook and Shopify retention playbook both show how to execute this step by step. If you want to layer in behavioral signals, behavior segmentation for retention expands RFM logic with browsing and engagement data.
Overcoming common obstacles: Data silos, intuition traps, and tactical solutions
Even with the right frameworks in hand, most teams hit the same wall: their data is scattered across too many systems to analyze coherently.
Data silos across platforms prevent actionable insights by forcing teams to work with incomplete transaction views. When your order data lives in Shopify, your email data sits in Klaviyo, and your ad spend is in a separate dashboard, you cannot build RFM segments or run market basket analysis with confidence. ETL (extract, transform, load) pipelines that unify this data are the practical fix.
“73% of eCommerce teams lack actionable dashboards despite having abundant data. The bottleneck is not collection. It is integration and interpretation.”
Here are the most common obstacles blocking actionable insights for marketing teams right now:
- Fragmented data sources: Orders, email, ads, and returns living in separate tools with no unified view
- Overreliance on descriptive metrics: Weekly sales reports that confirm what happened but offer no prescription
- Manual analysis bottlenecks: Analysts spending most of their time on data preparation rather than interpretation
- No feedback loop: Insights generated but never connected to campaign decisions or product changes
- Intuition override: Experienced team members dismissing data recommendations in favor of past patterns
Pro Tip: Before investing in more analytics tools, audit how your current transaction data flows. Export a 12-month order history and check whether you can match every transaction to a customer, product SKU, and date. If you cannot, that is your first bottleneck. Fix the data foundation before layering on analysis.
For teams trying to move faster, understanding actionable insights at a structural level helps clarify which gaps to address first. Platforms that accept CSV uploads or API connections let you feed clean order exports directly into analytics without rebuilding your entire data stack. Learning how to automate analytics solution processes also reduces the manual burden that keeps most teams stuck in descriptive mode.
If you run WooCommerce, understanding how to optimize WooCommerce sites for data output is a practical starting point for cleaner exports.
Why most e-commerce teams get actionable insights wrong (and what actually works)
Here is the uncomfortable pattern we see repeatedly: teams invest in analytics, build dashboards, run weekly reviews, and still make the same intuition-driven decisions they always have. The dashboards become wallpaper.
The problem is not effort. It is that descriptive KPIs work well for monitoring but fail at optimization. Watching your repeat purchase rate trend down over six months does not tell you which bundle to create or which segment to email. Prescriptive analytics, like AI-powered LTV models, does. It turns an observation into a specific recommendation. That gap between observation and recommendation is where most teams lose 3.7x in marketing efficiency.
The brands that get this right share one habit: they treat their analytics output as a decision queue, not a reporting artifact. Every insight generated has a named owner, a deadline, and a metric to move. Advanced bundling strategies only deliver when they are connected to that kind of execution discipline.
Stop building dashboards that describe the past. Start building workflows that prescribe the next action.
Take your insights from analysis to action
Understanding frameworks is valuable. Having a tool that runs market basket analysis and RFM segmentation on your actual transaction data is what moves the needle.

Affinsy is built for exactly this. You export your order history from Shopify, WooCommerce, BigCommerce, or any platform that produces transaction data, then feed it in via CSV upload or API. The platform surfaces product affinity scores for bundling, builds RFM segments for retention targeting, and gives your team clear next actions instead of raw numbers. You can start with market basket analysis, explore product bundling frameworks, or go straight into customer segmentation strategy. The free tier covers up to 20K line items with no credit card required.
Frequently asked questions
What makes an insight actionable for e-commerce marketers?
An actionable insight recommends a specific next step, such as creating a new bundle or targeting a retention segment, rather than simply reporting what already occurred. Prescriptive analytics layers on top of descriptive data are what produce that recommendation.
How can market basket analysis optimize product bundling?
It scans transaction history to find products frequently bought together, and a lift score above 1.3 signals an association strong enough to test as a formal bundle offering.
What is a healthy repeat purchase rate for e-commerce?
A 90-day repeat rate above 20% is a healthy benchmark, and brands with sustainable business models typically generate 40 to 60% of their revenue from returning customers.
How do data silos impact actionable insight generation?
Fragmented transaction data prevents teams from building the unified customer and product views needed for RFM segmentation, cohort analysis, and market basket analysis to work correctly.
Recommended
- Actionable Ecommerce Analytics Explained: Boost Revenue - Affinsy Blog | Affinsy
- 7 Effective Ways to Maximize Revenue in E-commerce - Affinsy Blog | Affinsy
- Sales Data Analysis: Unlocking E-Commerce Growth - Affinsy Blog | Affinsy
- Data Driven Ecommerce: Unlocking Revenue Potential - Affinsy Blog | Affinsy
- Local coupon marketing guide: attract customers and save big