
RFM analysis is a quantitative customer segmentation method that ranks every buyer in your database across three behavioral dimensions: Recency (how recently they purchased), Frequency (how often they buy), and Monetary value (how much they spend). Each dimension gets a score, typically on a 1–5 scale, and those scores combine into a single customer profile that tells you exactly who deserves your attention and who is drifting away. The underlying logic is the 80/20 rule: roughly 20% of your customers drive the majority of revenue, and RFM is the fastest way to find them.
Key points at a glance:
- Recency measures days or weeks since the last purchase; lower recency means higher score.
- Frequency counts total transactions in a defined period; more purchases earn a higher score.
- Monetary value sums total spend; bigger spenders score higher.
- Scores combine into an RFM cell (e.g., 5-5-5 for a top customer, 1-1-1 for a lapsed one).
- The method requires no specialized statistical software and has been a direct marketing staple since the 1990s.
- RFM applies across retail, subscription services, professional services, and e-commerce.
- Its primary purpose is identifying high-value and at-risk customers for targeted campaigns.
How RFM scoring and ranking actually work
The mechanics start with three raw numbers per customer: days since last purchase, total order count in your chosen window, and total revenue generated. You then bin each number into score tiers. With a 1–5 scale, the top 20% of buyers by recency get a 5; the bottom 20% get a 1. Frequency and monetary value follow the same logic.
| Dimension | What you measure | Score 5 (best) | Score 1 (worst) |
|---|---|---|---|
| Recency | Days since last purchase | Purchased very recently | Purchased long ago |
| Frequency | Number of orders in period | Buys most often | Rarely buys |
| Monetary | Total spend in period | Highest spenders | Lowest spenders |
| Combined RFM | Concatenated score | 5-5-5 (champion) | 1-1-1 (lost) |
Once each customer has three individual scores, you concatenate them into a combined RFM score. A customer who scores 5 on recency, 4 on frequency, and 5 on monetary value becomes a “5-4-5.” Some teams sum the scores instead (5+4+5=14), which works fine for simple ranking but loses the dimensional detail that makes segmentation useful.
Key scoring principles:
- Bin boundaries should reflect your actual customer distribution, not arbitrary round numbers.
- A customer who bought yesterday and one who bought last week may both land in the top recency bin if your window is monthly.
- Monetary scores can skew heavily if a few customers spend orders of magnitude more than the rest; consider capping outliers or using percentile bins.
- The combined score is a profile, not a grade. A 5-1-5 (recent, infrequent, high-spend) is a very different customer from a 5-5-1 (recent, frequent, low-spend).
Pro Tip: If you are working with a subscription business or a high-ticket category, try a 1–10 scale instead of 1–5. The extra granularity separates customers who would otherwise cluster in the same bin and makes your segments meaningfully distinct.
How RFM scores translate into customer segments
Segmentation is where the scoring pays off. With three dimensions and five bins each, you technically have 125 possible RFM cells. In practice, most teams collapse those into 6–12 named segments that map to distinct marketing actions.
Common segment types and their characteristics:
- Champions (5-5-5 range): Bought recently, buy often, spend the most. These are your VIPs.
- Loyal customers: High frequency and monetary scores, slightly lower recency. Still engaged, worth rewarding.
- Potential loyalists: Recent buyers with moderate frequency. One or two more purchases could move them up.
- At-risk customers: Previously high scorers whose recency has dropped sharply. Classic churn candidates.
- Hibernating: Low recency, low frequency, low monetary. Likely gone unless a strong win-back offer lands.
- New customers: High recency, low frequency. Just started; need nurturing to become regulars.
The real power of RFM segmentation is in the at-risk group. A customer who was a 5-5-5 six months ago and is now a 2-5-5 is sending a clear signal. Their frequency and spend are still strong, but they have not bought recently. That is a retention opportunity, not a lost cause.
Pro Tip: Do not try to act on all 125 cells at once. Pick 4–6 segments that map to real business decisions, name them in plain language your whole team understands, and build campaigns around those. Complexity kills execution.

Consider a mid-size apparel brand running a quarterly RFM pass. They identify 800 at-risk customers who were top spenders 12 months ago but have not purchased in 90 days. A targeted email with a personalized offer, referencing their past purchase category, typically outperforms a generic promotional blast to the full list. The segment does the targeting work so the message can do the persuasion work.
How to perform RFM analysis step by step
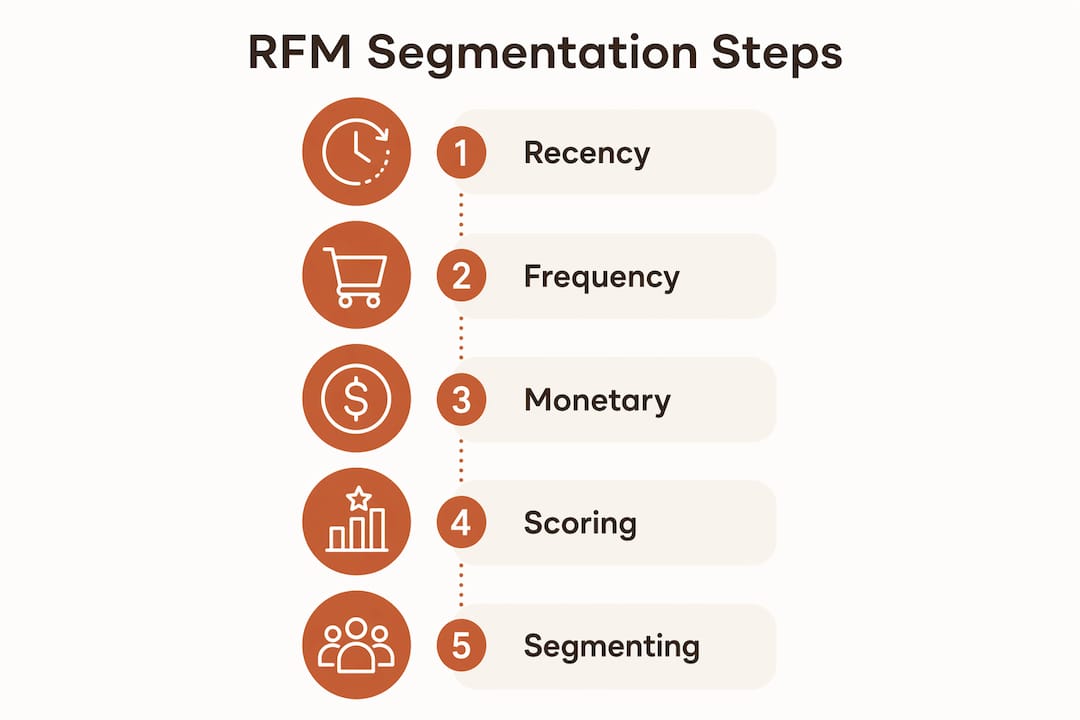
Getting from raw transaction data to actionable segments takes six focused steps.
- Collect your transaction data. You need three fields per order: customer identifier, purchase date, and order value. Structured transaction records are the foundation; garbage in means garbage segments out.
- Clean and deduplicate. Remove test orders, refunds, and duplicate records. Standardize customer IDs so one person does not appear as two.
- Set your analysis window. Decide the time period you are scoring against, typically 12 months for most retail categories, shorter for fast-moving goods, longer for infrequent high-ticket purchases.
- Calculate the three raw metrics per customer. Recency = days since last purchase. Frequency = count of orders in the window. Monetary = sum of order values in the window.
- Assign scores. Bin each metric into your chosen scale (1–5 is standard). Use percentile-based bins rather than fixed dollar or day thresholds so scores reflect your actual customer distribution.
- Combine scores and build segments. Concatenate or sum the three scores. Map score combinations to named segments. Export the segment list for your marketing team.
Best practices before you run the analysis:
- Define “recency” relative to a fixed reference date, not today’s date, so scores stay consistent across runs.
- Validate your segments on a holdout dataset. Using the same data to build and test segments inflates apparent accuracy.
- Adjust scoring thresholds dynamically based on product lifecycle. A daily consumable and a luxury appliance need very different recency windows.
- Document your threshold decisions so the next analyst runs the same model, not a different one.
Limitations worth knowing before you rely on RFM
RFM is powerful, but it only sees what your transaction log shows. It knows nothing about why a customer stopped buying, what they considered purchasing but did not, or whether they are buying from a competitor instead.
Common limitations:
- No demographic or psychographic context. Two customers with identical RFM scores can have completely different motivations, price sensitivities, and product preferences.
- Static thresholds misfire across categories. A recency score of 3 means something very different for a weekly grocery buyer versus an annual furniture buyer. Failing to calibrate thresholds to your specific business model skews every segment downstream.
- High monetary scores can mislead. An occasional big spender and a consistently loyal mid-spender may score similarly on monetary value but represent very different retention risks.
- RFM cannot predict lifetime value on its own. It describes past behavior; it does not model future probability of purchase without additional data or augmentation.
- Overfitting is a real risk. Building and testing your segments on the same dataset produces patterns that reflect noise, not actual customer behavior.
Pro Tip: Treat RFM as a diagnostic starting point, not a final answer. Layer in product category data, customer service history, or Net Promoter Score data to add the “why” behind the “what” that RFM surfaces.
Advanced practitioners use augmented models like RFMTC, which adds Time since first purchase and Churn probability to the standard three dimensions. This model uses probability theory to estimate the likelihood a customer will respond to the next campaign, giving you a predictive layer that pure RFM cannot provide on its own.
Marketing strategies that follow from RFM segmentation
Once you have your segments, the question is what to do with each one. The answer depends on where each group sits in the customer lifecycle.
Segment-specific strategies:
- Champions: Offer early access to new products, referral incentives, and VIP loyalty tiers. These customers already trust you; give them a reason to advocate.
- Loyal customers: Reward programs, personalized product recommendations, and cross-selling based on purchase history. Keep the relationship warm.
- At-risk customers: Win-back emails with a time-limited offer, a personal outreach from a customer success rep for high-value accounts, or a survey asking what changed. Proactive retention at this stage costs far less than reacquisition.
- New customers: Onboarding sequences, product education content, and a second-purchase incentive within 30 days of the first order.
- Hibernating: A reactivation campaign with a strong offer, but keep the spend modest. The conversion rate on truly lapsed customers is low; do not over-invest.
Personalized marketing built on RFM classification consistently outperforms batch-and-blast campaigns across email, SMS, and paid retargeting. The reason is simple: you are matching the message to the customer’s actual relationship with your brand, not guessing.
Pro Tip: For at-risk customers, test a two-step sequence: a soft re-engagement email first (no offer, just a relevant content piece or product update), followed by a discount offer only to those who opened. This filters for customers who are still interested and avoids training your best customers to wait for discounts.
Retention-focused strategies built on RFM data also pair naturally with customer retention tactics like loyalty programs and post-purchase follow-up sequences, where the segment determines the timing and tone of each touchpoint.
How AI-powered platforms change what RFM can do
Traditional RFM analysis is a spreadsheet exercise. You export data, calculate metrics, assign bins, and build a static snapshot that ages the moment you run it. AI-powered platforms change that by automating the entire pipeline and keeping segments current as new transactions arrive.

Affinsy is built around this idea. You export order data from Shopify, WooCommerce, BigCommerce, Stripe, or any system that produces transactional records, then feed it into Affinsy via API, CSV upload, or MCP. The platform calculates RFM scores, surfaces segment profiles, and flags customers whose recency is declining before they fully churn. No data science background required.
The practical difference shows up in two places. First, dynamic thresholding: instead of manually deciding where to draw the line between a score of 3 and a score of 4, the platform uses your actual data distribution to set bins that reflect real customer behavior. Second, trend analysis: Affinsy tracks how individual customers move between segments over time, so you can see a champion sliding toward at-risk status and act before the relationship breaks.
Pro Tip: Start with Affinsy’s free tier (up to 20K line items, no credit card required) to run your first RFM pass on real data. The output will show you which segments exist in your customer base before you commit to a full campaign build.
Combining RFM with market basket analysis inside the same platform adds another layer: you can see not just who your best customers are, but what product combinations they tend to buy, which feeds directly into cross-sell and upsell recommendations tailored to each segment.
Real-world examples of RFM analysis in action
RFM is not a theoretical framework. Businesses across industries use it to make concrete decisions every week.
E-commerce apparel: A direct-to-consumer brand runs a monthly RFM pass on its Shopify data. The at-risk segment, customers who spent over $300 in the past year but have not purchased in 60 days, receives a personalized email referencing their last purchase category. The champions segment gets early access to a new collection drop 48 hours before the general list.
Subscription SaaS: A software company uses frequency (feature usage events) and monetary (subscription tier) as proxies for the standard RFM metrics. Customers with declining usage frequency but high monetary scores trigger an automated check-in from the customer success team. This mirrors the retail at-risk logic but applied to churn prevention in a subscription context.
Catalog retail: RFM has been a catalog industry standard) for decades. Catalog teams use RFM scores to decide which customers receive the full printed catalog versus a lighter digital version, cutting print and postage costs while concentrating spend on the highest-probability buyers.
Professional services: A B2B firm tracks client recency (last engagement date), frequency (number of projects), and monetary value (total fees). Clients who score high on monetary but low on recency get a proactive outreach call, not a marketing email. The same RFM logic, applied to a relationship-driven context.
How RFM compares to other segmentation approaches
RFM is behavioral and backward-looking. That is both its strength and its constraint, and understanding where it fits relative to other methods helps you use it correctly.
Demographic segmentation groups customers by age, location, income, or gender. It tells you who someone is, not how they behave. RFM tells you the opposite. The two approaches complement each other; neither replaces the other.
Psychographic segmentation clusters customers by values, lifestyle, and motivations. This is richer but far harder to collect and maintain at scale. RFM requires only transaction data you already have.
Predictive CLV models use machine learning to forecast future revenue per customer. They are more accurate for long-range planning but require more data, more modeling expertise, and more compute. RFM gives you a usable approximation of customer value in an afternoon, without a data science team.
Cohort analysis tracks groups of customers who started at the same time to measure retention over time. It answers “how does our 2024 acquisition cohort compare to 2023?” RFM answers “who in our entire base is most valuable right now?” Both questions matter; they are just different questions.
RFD (Recency, Frequency, Duration) is a variant designed for media and content businesses where time spent, not money spent, is the value metric. A streaming platform or a publisher would use RFD where a retailer uses RFM.
The honest summary: RFM wins on simplicity, speed, and accessibility. It does not require a PhD, a data warehouse, or a six-week modeling project. For most marketing teams, that is exactly the right trade-off.
Tools and software for running RFM analysis
The right tool depends on your technical resources and data volume.
Spreadsheets (Excel, Google Sheets): Fully viable for smaller datasets under a few thousand customers. You calculate recency, frequency, and monetary columns manually, then use PERCENTRANK or QUARTILE functions to assign scores. The process is transparent and educational, but it does not scale and requires manual refresh.
Python and R: The rfm package in R and pandas-based workflows in Python handle large datasets efficiently and give you full control over binning logic. The R package documentation includes a step-by-step introduction that walks through score calculation and segment creation with real data. These are the right tools if you have an analyst on staff.
Business intelligence platforms: Tools like Tableau, Looker, and Power BI can run RFM calculations inside a connected data warehouse. Setup takes longer, but the output is a live dashboard that updates automatically as new orders arrive.
Purpose-built analytics platforms: Affinsy sits in this category. You upload transaction data via CSV or connect via API, and the platform handles scoring, segmentation, and visualization without requiring you to write a single line of code. The free tier covers up to 20K line items with full feature access, making it practical to test before committing. Paid plans (Pro at $49/month, Max at $199/month) unlock larger datasets and API access for teams that need to automate the pipeline.
The practical segmentation guide on the Affinsy blog walks through how to apply these tools specifically for e-commerce sales growth, with worked examples from real store data.
Key Takeaways
RFM analysis segments customers by Recency, Frequency, and Monetary value using a 1–5 scoring scale, giving marketing teams a fast, data-backed way to identify champions, at-risk buyers, and everyone in between.
| Point | Details |
|---|---|
| Three dimensions, one profile | Recency, Frequency, and Monetary scores combine into a single customer ranking that drives targeting decisions. |
| Threshold calibration matters | Scoring bins must reflect your product’s purchase cycle; a static threshold misclassifies customers in high-ticket or fast-moving categories. |
| At-risk segment is the priority | Customers with strong Frequency and Monetary scores but declining Recency represent the highest-ROI retention opportunity. |
| Validate on separate data | Using the same dataset to build and test segments produces overfitted results that do not hold in live campaigns. |
| AI platforms remove the manual work | Tools like Affinsy automate scoring, dynamic binning, and segment tracking so teams focus on campaign strategy, not data prep. |
Recommended
- RFM Analysis — E-Commerce Glossary | Affinsy | Affinsy
- RFM Model Ecommerce: Practical Segmentation Guide - Affinsy Blog | Affinsy
- Master RFM Analysis to Boost E-Commerce Sales - Affinsy Blog | Affinsy
- RFM Segmentation for DTC Brands: How to Identify and Win Back $500K+ in At-Risk Revenue - Affinsy Blog | Affinsy