
What does AOV mean, and how do you calculate it?
AOV stands for average order value, the average dollar amount a customer spends each time they place an order. Calculated by dividing total revenue by total orders over a given period, it tells you how much a single transaction is worth to your business, not how much a customer is worth over a lifetime.
The formula is straightforward:
AOV = Total Revenue ÷ Number of Orders

Say your store brought in significant revenue last month from many orders. Your AOV reflects the average transaction value. That number has nothing to do with how many unique customers shopped with you. Two orders from the same person count as two orders, not one customer with double the spend.
Key distinctions worth keeping in mind:
- AOV measures transaction value, not customer value
- It covers a specific time window (day, week, month, quarter)
- It is a mean average, which means outliers can pull it in either direction
Table of Contents
- Why average order value matters to your bottom line
- How to calculate average order value accurately
- Industry benchmarks: what a “good” AOV actually looks like
- Seven strategies to increase your average order value
- How AI-powered analytics can sharpen your AOV strategy
- Common mistakes to avoid when analyzing AOV
- Tools and software to track and analyze AOV
- Real-world AOV optimization: what actually works
- Key Takeaways
Why average order value matters to your bottom line
AOV is one of those metrics that looks simple on the surface but touches nearly every part of your business. Raise it slightly per order and, at thousands of orders a month, you increase monthly revenue without acquiring a single new customer.
That math is why marketers care so much about optimizing order value. Here is what tracking it actually gives you:
- Revenue efficiency. Higher AOV means more revenue from the same traffic, which directly improves return on ad spend (ROAS).
- Pricing and merchandising signals. A falling AOV often means customers are gravitating toward lower-priced SKUs, which is a prompt to revisit your product mix or promotional strategy.
- Customer lifetime value (CLV) leverage. AOV is one of the three inputs to CLV alongside purchase frequency and customer lifespan. Push AOV up and CLV follows.
- Free shipping threshold calibration. Knowing your AOV tells you exactly where to set a free shipping minimum to nudge customers to spend more without giving away margin.
AOV does not operate in a vacuum, though. A rising AOV paired with a falling conversion rate can mean you are pricing out casual buyers. The metric earns its value when you read it alongside conversion rate and customer acquisition cost (CAC).
How to calculate average order value accurately

Getting the formula right is easy. Getting a meaningful number takes a bit more care.
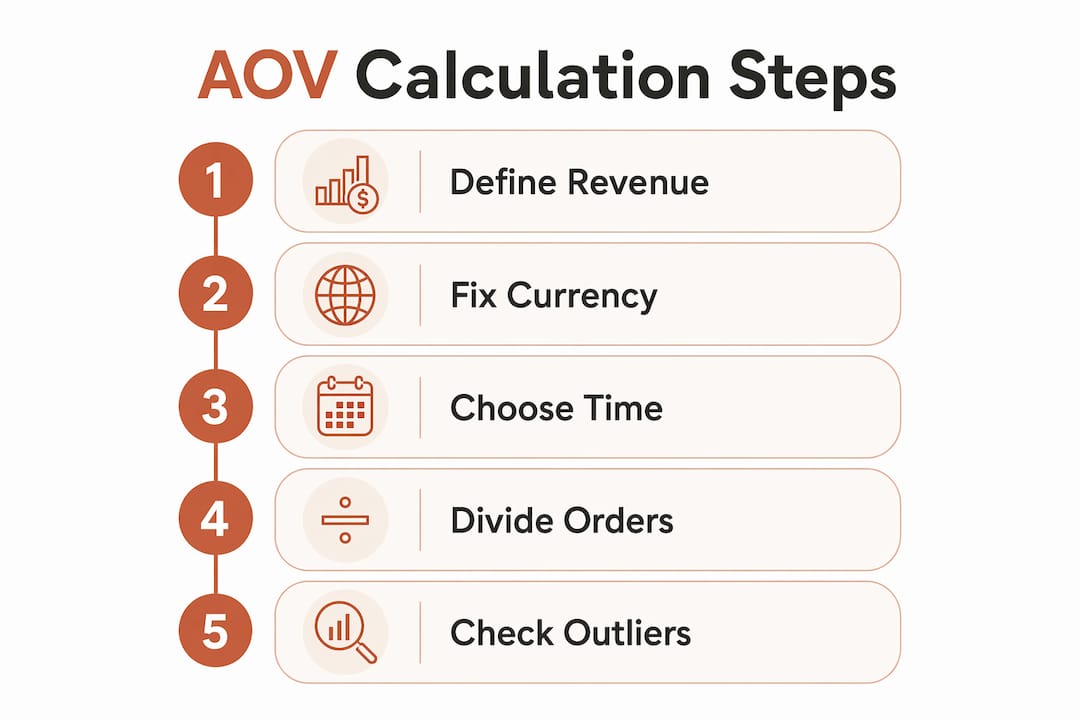
Step 1: Define your revenue base. Exclude taxes, shipping fees, and refunds before you divide. Including them inflates AOV in ways that make period-over-period comparisons unreliable. Net product revenue is the cleanest input.
Step 2: Fix your currency. If you sell in multiple markets, normalize everything to one base currency before calculating. A mixed-currency AOV is essentially noise.
Step 3: Choose a consistent time window. Monthly is the most common cadence for e-commerce. Weekly works for high-volume stores where you need faster feedback loops. Whatever you pick, stick with it so trends are comparable.
Step 4: Divide. Total net product revenue ÷ total orders in that period.
Step 5: Check for outliers. Mean, median, and mode together give you a fuller picture than the mean alone. One $5,000 wholesale order in a month of $50 consumer orders will drag your mean AOV up in a way that misrepresents typical customer behavior. If your mean and median diverge sharply, investigate why.
| Metric | What it tells you | When to use it |
|---|---|---|
| Mean AOV | Overall revenue per order | Standard reporting, trend tracking |
| Median order value | Typical customer spend, outlier-resistant | Diagnosing skewed distributions |
| Mode order value | Most common transaction amount | Pricing and threshold decisions |
A quick example: your store runs a flash sale in November. Total net revenue for the month is $200,000 across 4,000 orders. Mean AOV = $50. But the median order is $38, because a handful of bulk buyers inflated the mean. Your pricing decisions should probably anchor to $38, not $50.
Industry benchmarks: what a “good” AOV actually looks like
There is no universal benchmark for AOV, and anyone who gives you one without context is oversimplifying. AOV varies dramatically by product category, price point, and sales channel.
The most useful data point here: Amazon’s average order is moderately lower than direct-to-consumer Shopify brands, which tend to have a higher range due to bundling and loyalty incentives. The gap is not random. Amazon shoppers often buy single, low-cost items. DTC buyers are more likely to bundle, subscribe, or respond to upsell prompts at checkout.
| Sales channel / model | Typical AOV range | Key driver |
|---|---|---|
| Amazon marketplace | $52 | Single-item, price-comparison behavior |
| DTC Shopify brands | $85–$95 | Bundling, upsells, loyalty incentives |
| B2B / wholesale | $200+ | Bulk ordering, contract purchasing |
| Luxury / high-ticket | — | Premium pricing, curated SKU sets |
A few things to keep in mind when reading benchmarks:
- Category matters more than channel. A $50 AOV is strong for a snack brand and weak for a furniture retailer.
- Blind benchmarking misleads. Compare your AOV against direct competitors or your own historical data first. Generic averages rarely account for your SKU mix or customer segment.
- Seasonality distorts. Q4 AOV almost always runs higher due to gift purchasing. Strip out seasonal effects before drawing conclusions about underlying trends.
Seven strategies to increase your average order value
1. Set a free shipping threshold above your current AOV
If your AOV is moderate, set free shipping at a threshold noticeably above it. Customers who are already at $55 have a concrete reason to add one more item. The key is making the gap visible at checkout (“You’re $20 away from free shipping”). Free shipping thresholds are one of the most consistently effective AOV levers in e-commerce.
2. Cross-sell with product associations, not guesswork
“Customers also bought” works when the recommendations are genuinely relevant. When they are not, they get ignored. Market basket analysis surfaces which products actually appear together in real orders, so your cross-sell logic is grounded in purchase data rather than editorial intuition. Data-driven bundling consistently outperforms manually curated recommendations.
3. Bundle products at a slight discount
Pre-built bundles remove the decision friction of assembling a cart. A skincare brand that sells a cleanser, toner, and moisturizer separately for $90 total can bundle them at $79 and increase AOV while still improving margin per transaction compared to selling just one item. The discount feels like a deal; the AOV goes up.
4. Upsell at the right moment
The best upsell happens right before checkout, not after. Offer a premium version, a larger size, or an extended warranty when the customer has already committed to buying. Post-purchase upsells (on the confirmation page) also work well because the buying mindset is still active.
5. Use tiered loyalty rewards
Segmenting customers by purchase frequency lets you tailor incentives. Frequent buyers respond well to loyalty points and tier upgrades that reward higher spend. First-time buyers respond better to bundles and threshold discounts. Treating both groups identically leaves money on the table.
Pro Tip: Run an RFM (Recency, Frequency, Monetary) analysis on your order data to identify your top 20% of customers by spend. Target that segment with exclusive bundles or early access offers. Their AOV is already high; the goal is to keep them engaged and spending at that level.
6. Add social proof at the product and cart level
Orders influenced by social proof — reviews, user-generated content, ratings — tend to carry higher AOVs. A customer who sees 500 five-star reviews on a $120 product is more likely to add it to a cart that already has $60 in it. Place your highest-rated products in cross-sell slots, not just your highest-margin ones.
7. Optimize the checkout experience
A cluttered or confusing checkout kills upsell opportunities. Streamline the flow, surface relevant add-ons clearly, and make the value of adding one more item obvious. Reducing checkout friction and increasing AOV are not competing goals; they reinforce each other.
How AI-powered analytics can sharpen your AOV strategy
Tactics without data are guesses. The brands that move AOV consistently are the ones running segmented analysis on their actual order history, not applying generic best practices and hoping for the best.
Sophisticated brands track AOV dynamically and integrate with external marketing platforms like Klaviyo or Omnisend for segmentation that feeds directly into campaigns. The workflow looks like this:
- Export order data from Shopify, WooCommerce, BigCommerce, or Stripe
- Run market basket analysis to identify which product pairs and triplets co-occur most often in high-value orders
- Segment customers by RFM score to separate high-frequency buyers from occasional ones
- Build targeted campaigns: bundles for new buyers, loyalty incentives for repeat customers, win-back offers for lapsed high-spenders
- Export those segments to Klaviyo or Omnisend and measure AOV lift per segment
Affinsy handles this workflow through CSV upload or API, so teams without a data science background can run the analysis on their existing transaction data. The free tier covers up to 20,000 line items, which is enough for most mid-size stores to run a meaningful first analysis.
Balancing AOV with conversion rate and CAC is non-optional. An AOV that climbs because you added friction to the checkout, or because you raised prices past the market’s tolerance, is not a win. The goal is higher revenue per order and a healthy conversion rate. Tracking all three together, not AOV in isolation, is what separates sustainable growth from a metric that looks good until it doesn’t.
Customer retention strategies compound the AOV gains you make at the transaction level. A customer who buys at a $90 AOV and returns six times a year is worth far more than one who buys once at $120.
Common mistakes to avoid when analyzing AOV
Including shipping and taxes in revenue. This inflates AOV and makes your numbers incomparable to any external benchmark. Always use net product revenue.
Treating AOV as a standalone metric. An artificially high AOV without balanced conversion or CAC data can mask declining profitability. If AOV goes up but conversion drops, you may be losing more revenue than you gained.
Ignoring channel-level segmentation. Blending your Amazon and DTC orders into a single AOV figure produces a number that accurately represents neither channel. Track them separately.
Benchmarking against the wrong peer group. A $60 AOV in apparel is very different from a $60 AOV in electronics. Industry-wide averages rarely account for price point, SKU count, or customer segment.
Reacting to short-term swings. A single promotional week or a viral product moment can spike AOV temporarily. Build your analysis on rolling averages, not point-in-time snapshots.
Tools and software to track and analyze AOV
Most e-commerce platforms surface AOV natively. Shopify’s analytics dashboard shows AOV by date range, channel, and customer segment. Google Analytics 4 tracks it as “average purchase revenue” in the monetization reports. These are good starting points.
For deeper analysis, you need tools that go beyond the mean:
- Amplitude tracks AOV alongside behavioral data, so you can see which user actions correlate with higher-value orders.
- Klaviyo and Omnisend let you segment email lists by AOV tier and run targeted campaigns for each group.
- Affinsy runs market basket analysis and RFM segmentation on your raw transaction data, surfacing which product combinations drive the highest order values and which customer segments are most worth targeting. It connects via CSV or API, no direct platform integration required.
The right stack depends on your volume and technical resources. A store doing under $1M annually can get meaningful AOV insights from Shopify’s native reports plus a spreadsheet. Above that threshold, dedicated analytics tools pay for themselves quickly.
Real-world AOV optimization: what actually works
The bundle play. A home goods brand selling candles noticed through order data analysis that customers who bought a candle and a wick trimmer in the same order had an AOV 40% higher than single-item buyers. They built a “candle care kit” bundle, priced it at a small discount to buying separately, and featured it prominently on product pages. AOV for that category increased measurably within 60 days.
The threshold nudge. An apparel retailer with a $68 AOV set a free shipping threshold at $85. They added a cart progress bar showing how close customers were to the threshold. The result: more customers added a low-cost accessory to cross the line, and AOV moved toward the $80 range over the following quarter.
The segmentation shift. A subscription box company used RFM analysis to identify customers who had purchased three or more times in the past six months. That segment received a loyalty bundle offer exclusive to repeat buyers. Their AOV on the next purchase ran significantly higher than the store-wide average, while one-time buyers received a different offer designed to drive a second purchase rather than a larger first one.
These examples share a common thread: the tactic was chosen because the data pointed to it, not because it was a generic best practice. Understanding your AOV at the segment level is what makes the difference between a tactic that works and one that just sounds like it should.
Key Takeaways
Average order value is most useful when tracked by segment and channel, not as a single store-wide number, and optimized alongside conversion rate and CAC rather than in isolation.
| Point | Details |
|---|---|
| AOV formula | Divide total net product revenue by total orders for the period; exclude taxes, shipping, and refunds. |
| Channel differences | Amazon AOV averages $52; DTC Shopify brands typically land in the $85–$95 range. |
| Mean vs. median | Use both: a single large order can pull the mean far above typical customer spend. |
| Top AOV tactics | Free shipping thresholds, data-driven cross-sells, and RFM-based loyalty offers consistently move the number. |
| Avoid isolation | AOV rising while conversion falls can signal net revenue loss; always read it alongside CAC and conversion rate. |
Recommended
- Understanding AOV: Average Order Value Explained - Affinsy Blog | Affinsy
- Average Order Value (AOV) — E-Commerce Glossary | Affinsy | Affinsy
- What Is Average Order Value and Why It Matters - Affinsy Blog | Affinsy
- Increasing Average Order Value Steps: Boost Sales Effectively - Affinsy Blog | Affinsy