
TL;DR:
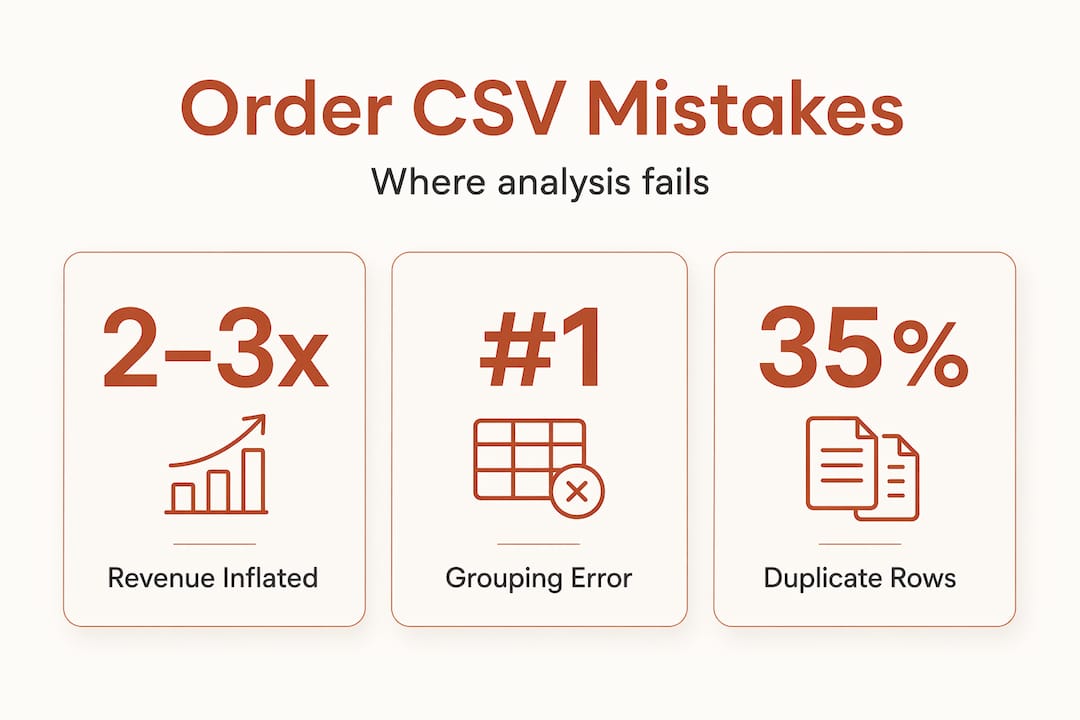
- Summing line items without grouping by order ID leads to inflated revenue metrics, often by two to three times.
- Proper data cleaning, normalization, and aggregation are essential to derive accurate insights from CSV order files; tools like DuckDB facilitate scalable SQL querying.
Your revenue number just tripled. Not because sales spiked, but because you summed the wrong column. This is one of the most common and costly mistakes in CSV order analysis, and it happens when analysts treat every row in an export as a separate order. Shopify, WooCommerce, and most other platforms export one order across multiple line-item rows, meaning a single $150 purchase with three products appears as three rows. Add those up without grouping by order ID, and your metrics are fiction. This guide walks you through the real structure of order CSV files, how to clean and aggregate them correctly, and how to turn that data into decisions that actually move the needle.
Table of Contents
- Key takeaways
- CSV order analysis: understanding data structure and pitfalls
- Cleaning and preparing your CSV order data
- Aggregating CSV orders to uncover real sales insights
- Tools and workflows for repeatable analysis
- Turning analysis results into business decisions
- My honest take on why CSV analysis goes wrong
- Put your CSV data to work with Affinsy
- FAQ
Key takeaways
| Point | Details |
|---|---|
| Multi-row orders inflate metrics | Summing line items without grouping by order ID can overstate revenue by 2 to 3x. |
| Cleaning before analysis is non-negotiable | Normalizing dates, deduplicating records, and fixing encodings prevents silent errors in your results. |
| Aggregation is the turning point | Grouping by order ID and applying correct sums gives you accurate AOV, revenue, and product performance data. |
| SQL beats spreadsheets at scale | Tools like DuckDB let you query large CSV files fast without loading everything into memory. |
| Interpretation drives strategy | Geographic, seasonal, and bundle analysis from clean CSV data directly informs marketing and inventory decisions. |
CSV order analysis: understanding data structure and pitfalls
Before you write a single formula or query, you need to understand what you are actually looking at. Most e-commerce platforms do not export one row per order. They export one row per line item. A customer who buys a t-shirt, a hat, and a pair of socks in one transaction generates three rows in your CSV, all sharing the same order ID.
Shopify order CSVs contain between 30 and 50 columns, including fields like "Name(the order identifier),Paid at, Subtotal, Total, Lineitem name, Lineitem quantity, and shipping information. The Discount Code` column alone opens up a whole dimension of analysis around promotional impact. But none of that matters if you misread the structure first.
The most damaging mistake? Summing revenue without grouping by the order identifier inflates figures by 2 to 3x. If your average order contains three line items, your total revenue looks three times larger than it actually is. That is not a minor rounding error. That is a broken dashboard.
| Column | Type | Analytical use |
|---|---|---|
Name / Order ID |
Identifier | Group rows to reconstruct order-level metrics |
Paid at |
Date/time | Time-series revenue and seasonality analysis |
Subtotal |
Currency | Pre-discount order value (appears on first row only) |
Lineitem name |
String | Product performance and bundle analysis |
Lineitem quantity |
Integer | Units sold per SKU |
Discount Code |
String | Promo effectiveness tracking |
Shipping City / Country |
String | Geographic segmentation |
Other data quality issues compound the problem. Missing payment dates break time-series summaries. Duplicate rows from re-exports inflate counts. Inconsistent country names like “US”, “USA”, and “United States” split what should be one group into three. Address these before analysis, not after.

Pro Tip: When you first open an order CSV, check which columns repeat across rows for the same order ID and which appear only on the first row. Fields like Total are typically populated only on the first line item row. Summing that column gives you a double or triple count instantly.
Cleaning and preparing your CSV order data
Think of data cleaning as the foundation. Get it wrong and everything built on top of it is unreliable. A systematic cleaning workflow is the difference between results you can trust and results you have to caveat endlessly.
Here is a practical sequence to follow before any analysis:
- Inspect file shape and encoding. Open the file in a text editor or run a head check in Python. Confirm the delimiter is a comma, not a tab or semicolon. Fix encoding issues (UTF-8 is your target) before any parsing begins.
- Standardize column names. Strip whitespace, convert to lowercase, and replace spaces with underscores.
Paid Atbecomespaid_at. This prevents silent mismatches when you join or re-run scripts. - Parse date columns explicitly. Never trust auto-detection. Specify the format in code. A column that looks like a date to Excel may be stored as a string in the raw file.
- Handle missing values by purpose. For time-series work, rows missing order dates should be dropped. For product analysis, a missing discount code just means no discount was applied. Context determines treatment.
- Deduplicate on two levels. First remove exact row duplicates from re-exports. Then check for multiple rows with the same order ID and line item combination, which signals a data pipeline issue upstream.
- Normalize categorical fields. Country names, product categories, and payment methods need consistent values. “United States”, “US”, and “USA” should all map to one canonical value before you run any geographic aggregation.
- Validate primary key integrity. Aggregating by order identifier is only reliable when that identifier is actually unique at the order level. Check that your order ID behaves as expected before treating it as the grain.
Pro Tip: Always convert date fields to ISO 8601 format (YYYY-MM-DD) immediately after parsing. This format sorts correctly as a string, plays nicely with every SQL engine and Python library, and eliminates ambiguity between MM/DD/YYYY and DD/MM/YYYY conventions that can silently corrupt your monthly revenue rollups.
Aggregating CSV orders to uncover real sales insights
Once your data is clean, aggregation is where the real analysis begins. The core principle is straightforward: treat the order ID as your grain, group all line-item rows under it, and compute order-level totals from there.
Here is what that unlocks in practice:
- Accurate average order value (AOV). Sum
lineitem_price * lineitem_quantityfor each order, then average across orders. Not across rows. This single correction changes your AOV calculation fundamentally. - Revenue by product or category. Group by
lineitem_nameacross all orders to rank product performance. Weight by quantity sold to see true volume, not just transaction count. - Discount code effectiveness. Group by
discount_code, compute total revenue per code, and compare against orders with no discount. You can measure whether that 15% off campaign actually brought in net-positive revenue or just cannibalized full-price buyers. - Time-series revenue trends. Use the
paid_atdate to bucket revenue by day, week, or month. Seasonal spikes, post-holiday dips, and campaign lift all become visible. This is where clean date parsing pays off directly. - Geographic sales distribution. Aggregate revenue and order count by shipping country or city. If 40% of your orders ship to three metro areas, that shapes your ad spend allocation and fulfillment strategy.
- Product affinity and bundle analysis. This is where multi-row order structure works in your favor. Because one order contains multiple line items, you can identify products that appear together frequently. Product pairs with high lift scores (lift > 1) indicate meaningful co-purchase behavior you can use to design bundles or trigger cross-sell recommendations.
Pro Tip: When joining your order CSV to other datasets like a product catalog or a customer list, always join on immutable identifiers such as SKU codes or customer IDs. Joining on product names introduces silent mismatches whenever a name changes or has a typo. Your metrics will look fine while being quietly wrong.
A common mistake worth calling out explicitly: analysts sometimes compute AOV by dividing total revenue by total row count instead of total order count. If your average order has 2.5 line items, this deflates your AOV by 60%. Always count distinct order IDs, not rows.
Tools and workflows for repeatable analysis
The right tool depends on your dataset size and how often you repeat the analysis. For one-off exploration on a small file, Python with pandas handles most tasks. For anything above 100,000 rows, or analysis you run weekly, you need something more durable.
Here are the approaches worth knowing:
- Python with pandas. Read CSVs with explicit dtypes and date parsing, clean and group with standard operations, and export summaries to new CSVs or visualizations. The pandas
groupbymethod is the core of every order aggregation workflow. - DuckDB for SQL on CSV files. DuckDB streams CSV files and executes SQL queries without loading the full dataset into RAM. You can write
SELECT order_id, SUM(lineitem_total) FROM read_csv_auto('orders.csv') GROUP BY order_idand get results in seconds on files with millions of rows. It also runs inside Python, so you get SQL expressiveness without a separate database server. - Chunked reading for large files. When files exceed available memory, read in chunks and aggregate iteratively. Pandas supports this natively with the
chunksizeparameter. - Saved query files as analysis recipes. Every cleaning step and aggregation query you write should live in a version-controlled
.sqlor.pyfile. When next month’s export arrives, you run the same script and get comparable results. Ad-hoc spreadsheet analysis cannot do this. - Immutable joins for multi-file analysis. When combining your order CSV with a product or customer CSV, join on stable IDs. Durable, repeatable queries built on immutable keys are far easier to maintain than formulas that depend on string matching.
The shift from spreadsheets to code is a one-time investment that compounds. A well-structured script you write today handles next quarter’s data without modification.
Turning analysis results into business decisions
Clean data and correct aggregations give you numbers. But the goal is decisions. Here is how to connect the output of your CSV analysis to concrete business actions.
Start with your product performance ranking. The top 20% of SKUs by revenue is your core catalog. The bottom 20% with low velocity and no bundle affinity may be candidates for discontinuation or promotion. This is a straightforward inventory prioritization exercise that most businesses skip because they never aggregate their data correctly in the first place.
Geographic analysis tells you where your customers actually are, not where you assume they are. If you discover that 35% of your revenue comes from a region you have never targeted in paid ads, that is a media budget reallocation waiting to happen. The same logic applies to underperforming regions where fulfillment times are long. Your CSV shipping data can surface that directly.
Seasonal patterns from time-series analysis let you plan promotions before demand peaks rather than reacting to it. If your data shows a consistent revenue spike in the third week of October across three years, you have enough signal to pre-position inventory and run campaigns in advance.
Pro Tip: Before acting on any finding, do a basic sanity check: compare your CSV-derived revenue totals against your payment processor or platform dashboard. A 5 to 10% discrepancy is normal due to refunds or timing. Anything beyond that suggests a data quality issue you have not resolved yet.
- Validate findings against a second source before presenting them as conclusions.
- Check whether geographic spikes correlate with a campaign or a PR event before attributing them to organic demand.
- Segment your high-AOV customers by cohort to see whether they are new or repeat buyers. The business implication is very different in each case.
My honest take on why CSV analysis goes wrong
I’ve worked with dozens of e-commerce teams that were confident in their data, and almost every one of them had at least one fundamental aggregation error buried somewhere in their reporting. The most common one, as this whole article addresses, is the multi-row order problem. But what surprises me more is how often analysts know about it in theory and still get it wrong in practice because they grabbed someone else’s spreadsheet formula without understanding what it was summing.
What I’ve learned is that sophisticated modeling is rarely the bottleneck. The bottleneck is almost always data quality and structural misunderstanding. A business that correctly aggregates and cleans its order CSV will get more actionable insight from a basic frequency table than a business running machine learning on dirty data.
I’ve also seen teams resist moving from spreadsheets to SQL or Python because it feels like a step backward into complexity. It is not. Writing a 20-line script that cleans and aggregates your monthly export takes less time after the second run than building the same logic in a spreadsheet does on the first. The investment front-loads the work so you can actually spend time interpreting results instead of wrestling with formulas. If you have not started treating your analysis as a repeatable workflow yet, that is the highest-leverage change you can make.
— Mateusz
Put your CSV data to work with Affinsy
If you have reached the point where your CSV order data is clean and correctly aggregated, the next question is what to do with it. That is exactly where Affinsy comes in.
Affinsy accepts CSV uploads directly. No integrations, no connectors. You export your order data from Shopify, WooCommerce, BigCommerce, or any platform that produces transactional data, upload it, and Affinsy runs market basket analysis and RFM customer segmentation on top of it automatically. You get product affinity scores, cross-sell recommendations, and customer value tiers without writing a single line of code. If you are on WooCommerce and want cleaner exports to start with, the free order exporter plugin from Affinsy formats your data exactly as needed for analysis. The free tier covers up to 20,000 line items with no credit card required.
FAQ
What is CSV order analysis?
CSV order analysis is the process of cleaning, aggregating, and interpreting order data exported as a CSV file to uncover sales trends, product performance, and customer behavior patterns.
Why does summing CSV revenue rows inflate the total?
Most e-commerce platforms export one row per line item, not one row per order. Summing monetary fields without grouping by order ID counts the same order’s revenue once per product, inflating totals by 2 to 3x.
What is the most important step before analyzing order CSV files?
Cleaning comes first. Parsing dates correctly, deduplicating rows, and normalizing categorical fields like country names prevents silent errors that corrupt every downstream metric.
What tools are best for analyzing large order CSV files?
DuckDB is particularly effective because it queries CSV files directly using SQL without loading the full file into memory, making it fast and scalable for large datasets. Python with pandas is the standard for smaller files and custom cleaning workflows.
How does product affinity analysis work with CSV order data?
Because each order can contain multiple line items, you can identify products that appear together across orders. Pairs with a lift score above 1 indicate statistically meaningful co-purchase behavior, which you can use to build bundles or trigger cross-sell campaigns.