
TL;DR:
- Customer behavior analysis drives 35% of Amazon’s revenue by personalizing recommendations.
- Utilizing micro-signals and predictive insights improves customer retention and increases average order value.
- Effective e-commerce strategies require integrated tools, real-time data, and proactive engagement based on behavioral signals.
Personalized recommendations account for 35% of Amazon’s revenue, and brands that deploy clickstream analytics have seen CTR increases of up to 120%. Those numbers aren’t accidents. They’re the result of treating customer behavior analysis as a core growth engine, not a reporting afterthought. If you manage an e-commerce brand and you’re still relying on last-click attribution and monthly dashboards, you’re leaving serious revenue on the table. This article walks through what customer behavior analysis actually is, how it drives conversions and retention, which tools matter most, and how to turn raw signals into revenue-generating action.
Table of Contents
- What is customer behavior analysis and why does it matter?
- How customer behavior analysis drives conversions and retention
- Key methods and technologies for analyzing customer behavior
- Turning data into action: Real-world applications for growth
- Why most brands miss the true value of customer behavior analysis
- Take behavioral analysis further with Affinsy
- Frequently asked questions
Key Takeaways
| Point | Details |
|---|---|
| Personalization drives revenue | Behavior analysis enables tailored offers that significantly boost sales. |
| Retention equals profit | Small improvements in retention rates can produce outsized gains in e-commerce profit. |
| Predictive analytics is a game changer | Leveraging micro-signals for prediction turns data into proactive growth strategies. |
| Integrated tech stack is crucial | Combining multiple analytics tools provides a comprehensive view of customer journeys. |
What is customer behavior analysis and why does it matter?
Customer behavior analysis is the practice of collecting, tracking, and interpreting every signal a shopper produces during their journey with your brand. That includes obvious data points like purchases and cart additions, but also subtler ones: how long someone hovers on a product image, which search terms they use, and when they abandon a session. These are called micro-signals, and they’re often more predictive than the final transaction itself.
The difference between basic tracking and true behavioral analysis comes down to intent. Most brands track what happened. Behavioral analysis tells you why it happened and, more importantly, what’s likely to happen next. That shift from reactive to predictive is where the real competitive advantage lives.
Key terms worth knowing:
- Clickstream: The sequential record of every page and element a user interacts with during a session
- Micro-signals: Small behavioral cues like wishlist adds, zoom interactions, or repeat product views that indicate purchase intent
- Cohort: A group of customers who share a common characteristic, such as acquisition month or first product category
“Analyzing customer behavior enables e-commerce brands to personalize recommendations and predict purchases, directly fueling revenue growth at scale.”
For scaling brands, this isn’t optional. The brands winning in 2026 are those that use behavioral data to anticipate customer needs before the customer articulates them. If you want a solid grounding in the mechanics, our e-commerce data analysis guide covers the foundational framework. You can also bookmark our analytics glossary for quick reference on any term you encounter.
The bottom line: behavioral analysis is the foundation for every meaningful personalization, segmentation, and retention strategy your brand can run.
How customer behavior analysis drives conversions and retention
Now that we’ve defined the approach, let’s see its concrete impact on e-commerce sales and loyalty.
Behavioral segmentation allows you to group customers not just by demographics but by how they actually shop. That distinction matters enormously when you’re crafting offers, email sequences, or product recommendations. A customer who browses three times before buying responds to different messaging than one who converts on the first visit.

The retention numbers are striking. E-commerce brands average a 25-40% annual repeat purchase rate, and a 5% improvement in retention can boost profits by 25-95%. Repeat customers also spend significantly more, with an average order value of $98 compared to $59 for first-time buyers, a 67% difference.
| Metric | First-time buyers | Repeat customers |
|---|---|---|
| Average order value | $59 | $98 |
| Profit impact of 5% retention lift | Baseline | Up to 95% more |
| Annual repeat rate (e-commerce) | N/A | 25-40% |
To align your marketing with behavioral insights, follow this sequence:
- Collect and unify behavioral data from your storefront, email platform, and ad channels
- Segment customers by purchase frequency, recency, and category affinity
- Map behavioral triggers to specific campaign actions, such as a re-engagement email after 30 days of inactivity
- Personalize recommendations at the product and category level for each segment
- Measure and iterate using retention rate, repeat purchase rate, and lifetime value as primary KPIs
Pro Tip: Don’t wait for a customer to churn before acting. Use behavioral signals like a drop in session frequency or a shift from browsing to wishlist-only behavior as early warning flags. Our guide on how to optimize retention walks through specific trigger-based workflows.
For deeper guidance on recommendation logic, the product recommendations guide and our overview of customer segmentation are worth reading together.
Key methods and technologies for analyzing customer behavior
To apply these insights, brands need the right combinations of methodologies and technology.
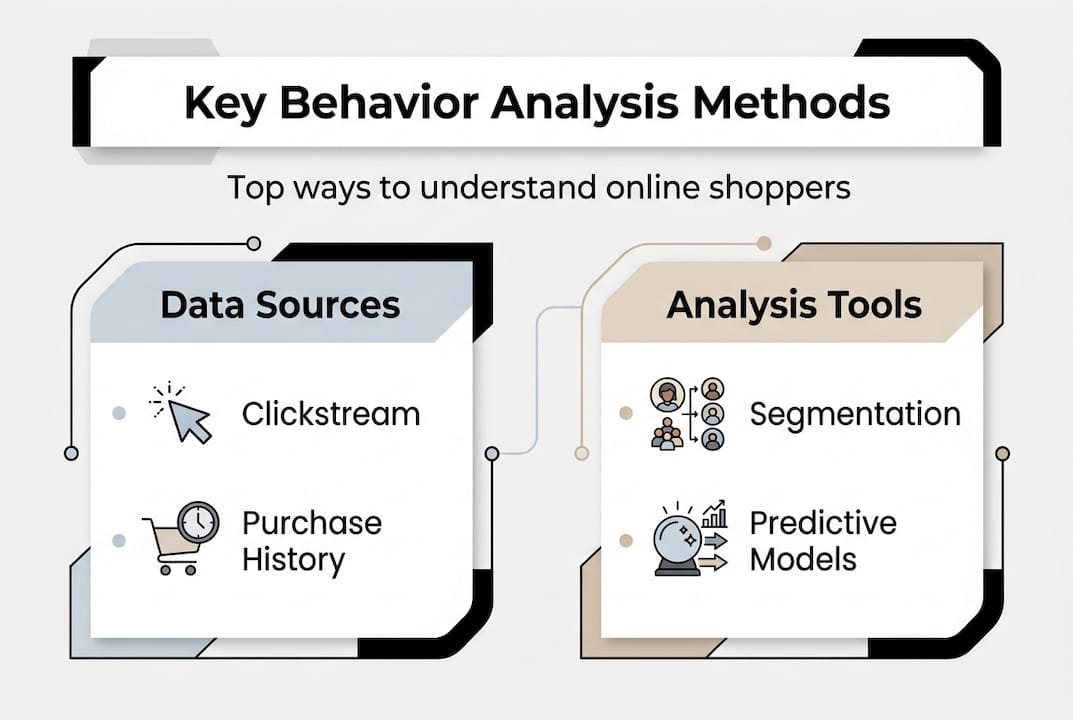
No single tool gives you the full picture. The most effective analytics stacks for mid-to-large e-commerce brands layer multiple data sources and analysis methods. Integrating GA4 and clickstream data with a customer data platform (CDP) creates a holistic view of behavior across sessions, devices, and channels. Benchmarking against your vertical, such as the 25-30% retention rate typical in fashion, helps you identify which segments deserve more investment.
| Method | Strengths | Best use case |
|---|---|---|
| GA4 and clickstream | Real-time session data, funnel visibility | Conversion optimization |
| Market basket analysis | Uncovers product co-purchase patterns | Cross-sell and bundle strategy |
| RFM segmentation | Ranks customers by recency, frequency, value | Retention and loyalty campaigns |
| Cohort analysis | Tracks behavior over time by group | Measuring campaign and product impact |
| Heatmaps | Visual interaction data on-page | UX and layout optimization |
| Predictive analytics | Forecasts future behavior from historical data | Proactive personalization and churn prevention |
A modern analytics stack for e-commerce should include:
- A unified event tracking layer that captures clickstream data across devices
- A CDP or data warehouse to consolidate behavioral and transactional records
- Segmentation tooling capable of RFM and cohort-based grouping
- Market basket analysis to surface product association rules
- A reporting layer that surfaces actionable insights, not just raw numbers
For a forward-looking view of where these tools are heading, our piece on analytics trends 2026 is worth your time. And if you want to see how market basket analysis applies beyond simple product pairings, the market basket analysis cases article covers some genuinely surprising applications.
Turning data into action: Real-world applications for growth
Once the tech and data practices are in place, here’s how leading brands put analysis to work.
The shift from reactive tracking to a predictive flywheel, the model Amazon has refined over decades, is about prioritizing micro-signals over macro events. Instead of waiting for a customer to lapse, you act on the first signs of disengagement. Instead of recommending bestsellers to everyone, you surface the specific product that matches this customer’s browsing pattern from the last 14 days.
Here’s how that plays out across four common scenarios:
- Offer personalization: A customer repeatedly views a product but doesn’t convert. Trigger a targeted discount or a “low stock” alert based on that specific behavior, not a blanket promotion.
- Proactive retention: Customers who haven’t purchased in 45 days but were previously buying monthly get a personalized win-back sequence with category-specific content, not a generic newsletter.
- Cross-selling at the right moment: Market basket analysis reveals that customers who buy product A frequently add product B within two weeks. Automate a post-purchase recommendation for product B at day 10.
- Churn prevention: A high-value customer’s session frequency drops by 60% over three weeks. Flag them for a proactive outreach campaign before they cancel or go silent.
Pro Tip: Micro-signals are your earliest action opportunities. A wishlist add without a purchase, a second visit to the same category page, or a price-check behavior pattern all indicate intent. Build automated triggers around these signals before you invest in larger campaign infrastructure.
To measure the impact of these actions, track: repeat purchase rate, time to second purchase, retention rate by cohort, and average order value by segment. Our articles on churn prediction and recommendation tactics go deeper on measurement frameworks.
Why most brands miss the true value of customer behavior analysis
Here’s the uncomfortable reality: most e-commerce brands are using behavioral data to describe the past, not shape the future. They look at last month’s conversion rate, identify which campaigns performed, and optimize accordingly. That’s not analysis. That’s a recap.
The brands that actually move the needle have made a mindset shift. They treat behavioral data as a live signal system, not a historical archive. The predictive flywheel model works because it acts on micro-signals in near real-time, not after the fact.
Siloed data is the second major obstacle. When your email platform, storefront analytics, and ad data live in separate systems, you never see the full customer journey. You see fragments. And fragments lead to fragmented decisions.
The third issue is leadership framing. Many organizations measure the success of analytics investments by the volume of data collected or the number of dashboards built. Neither of those things drives revenue. What drives revenue is acting on the right signal at the right moment for the right customer segment. That requires investing in outcomes, not infrastructure for its own sake.
Our perspective: the brands that will dominate in the next three years are the ones treating churn prediction impact and proactive personalization as board-level priorities, not analytics team projects.
Take behavioral analysis further with Affinsy
If this article has clarified the what and why of customer behavior analysis, Affinsy is built to handle the how at scale.

Affinsy is an AI-powered analytics platform that processes your historical transaction data to surface product association patterns and customer segmentation insights through market basket analysis and RFM scoring. You can learn more about the underlying mechanics through our glossary entries on customer segmentation, predictive analytics, and market basket analysis. Upload a CSV, connect via API, or use MCP. The free tier covers up to 20K line items with no credit card required. For brands ready to act on behavioral data, not just collect it, Affinsy is the next step.
Frequently asked questions
What types of data are most important in customer behavior analysis?
Clickstream paths, purchase histories, session duration, and micro-interactions like wishlist adds and product views are the most actionable inputs for behavioral analysis. These signals reveal intent long before a purchase decision is made.
How does customer behavior analysis impact retention rates?
Targeted actions from behavioral insights can drive e-commerce retention rates to 25-40% annually, and a 5% retention lift can boost profit by as much as 95%. The key is acting on behavioral signals before customers disengage.
Which analytics tools are best for mid-to-large e-commerce brands?
A combination of GA4 with a CDP provides a scalable, holistic stack for tracking behavior across channels and devices. Layering in market basket analysis and RFM segmentation tools completes the picture.
How do predictive models use behavioral data?
Predictive models ingest browsing and buying signals to forecast future actions, enabling tailored offers and proactive outreach before a customer churns or disengages. The earlier the signal, the more effective the intervention.
Recommended
- E-commerce Data Analysis Tutorial: Boost Sales with Insights - Affinsy Blog | Affinsy
- Guide to E-Commerce Data Analysis for Increased Sales - Affinsy Blog | Affinsy
- How to Analyze Ecommerce Sales Data for Better Growth - Affinsy Blog | Affinsy
- Sales Data Analysis: Unlocking E-Commerce Growth - Affinsy Blog | Affinsy
- Blog Amazon | Strategii și Informații - Agile Consultancy