
TL;DR:
- Automated, data-driven cross-sell recommendations outperform manual curation by nearly doubling acceptance rates. Building an effective engine requires reliable transaction data, key metrics, and strategic placement, with ongoing experimentation to optimize performance. Incorporating real-time session context can further personalize suggestions and significantly improve relevance and conversions.
You’ve manually curated “frequently bought together” lists, written category-based rules, and maybe even asked your merchandising team to guess which products pair well. Yet the numbers stay flat. The reality is that automated, data-driven recommendations consistently outperform manual curation, delivering nearly double the acceptance rates. This guide walks you through every layer of building a high-performing cross-sell engine: the data you need, the metrics that matter, where to place recommendations for maximum impact, and when to graduate to real-time personalization.
Table of Contents
- What you need to get started: Data, tools, and prerequisites
- Step-by-step: Building your cross-sell recommendation engine
- Experimentation and placement: Improving cross-sell acceptance and performance
- Advanced approaches: Context-aware and real-time recommender models
- The big picture: What most get wrong about data-driven cross-sell optimization
- Ready to accelerate your cross-sell performance?
- Frequently asked questions
Key Takeaways
| Point | Details |
|---|---|
| Transaction data is essential | Reliable cross-sell recommendations start with granular basket-level transaction history. |
| Association metrics drive value | Support, confidence, and lift metrics pinpoint product pairs most likely to boost basket size. |
| Placement impacts acceptance | Where and how recommendations appear often matters as much as what is recommended. |
| Experiment for continued growth | Rigorous A/B testing of recommendations, layouts, and touchpoints is key to lasting sales lift. |
| Real-time models upgrade results | Adding session/context awareness personalizes recommendations, raising both relevance and conversion. |
What you need to get started: Data, tools, and prerequisites
To build reliable cross-sell recommendations, you first need to ensure you have the right inputs and analytic capabilities in place. Many teams skip this foundation and wonder later why their model produces irrelevant pairings.
The core data you need
The minimum viable input is a clean, SKU-level transaction log. Each row should capture at least an order ID, a customer ID, a product identifier (SKU or variant), a timestamp, and a quantity. Understanding e-commerce cross-selling basics will help you see why granularity at the line-item level matters so much. Aggregate order summaries won’t work because you need to know which products appeared in the same basket, not just which orders had high value.
| Data field | Why it matters | Minimum threshold |
|---|---|---|
| Order ID | Groups items into baskets | Required |
| SKU / product ID | Identifies co-purchased items | Required |
| Customer ID | Enables repeat-purchase segmentation | Strongly recommended |
| Timestamp | Time-decay and seasonality weighting | Recommended |
| Quantity | Filters bulk / anomalous orders | Recommended |
| Category | Filters nonsensical cross-category pairs | Optional |
Key metric definitions you must know
Before touching any code, internalize these four terms:
- Support: How often two products appear together as a fraction of all transactions. Low support means a pairing is rare; high support means it’s common.
- Confidence: Given that a customer bought Product A, how often did they also buy Product B? This is a conditional probability.
- Lift: Is the co-purchase more frequent than chance? A lift above 1.0 means the pairing is positively correlated. Lift below 1.0 means the products actually repel each other in baskets.
- Conditional frequency: A simpler, more interpretable count of how often B appears when A is present. Useful for stakeholder communication.
As transactional market-basket data enables scalable computation via SQL or modern database aggregation, having your data in a queryable format from the start saves enormous time down the line.
Tools and infrastructure
You don’t need a full data science stack on day one. A SQL database (PostgreSQL, BigQuery, or even SQLite for smaller catalogs), a BI dashboard for visualization, and a basic recommendation layer are enough to start. For automated e-commerce workflows at scale, you’ll eventually want a pipeline that refreshes associations on a cadence, such as weekly or nightly, depending on your transaction volume.
Pro Tip: Start with at least 12 months of transaction history to capture seasonal variation. A summer garden product paired with fertilizer might look unrelated in January data but be your best cross-sell in May.
Step-by-step: Building your cross-sell recommendation engine
With your data infrastructure ready, you can now focus on the actual mechanics of building your data-driven cross-sell engine.
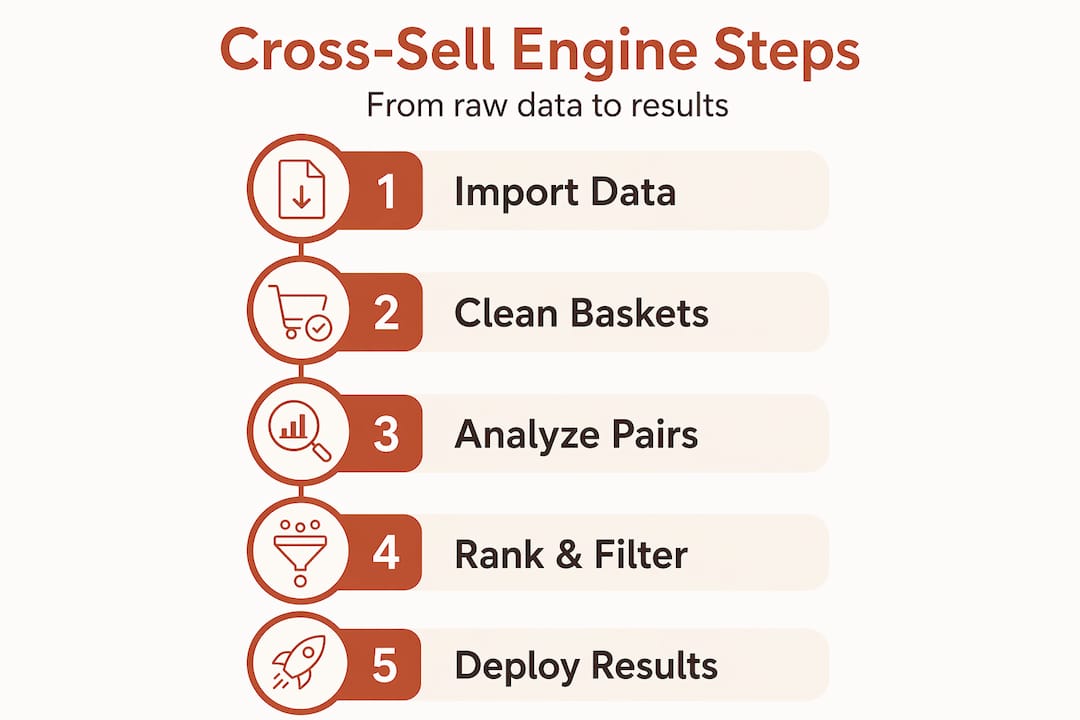
Step 1: Extract and normalize basket data
Pull your transaction log into a working table. Remove test orders, staff orders, and returns. Filter out single-item baskets since they contribute zero pairing signal. Normalize product IDs so that color variants of the same item don’t fragment your data unless variant-level recommendations are intentional.

Step 2: Compute support, confidence, and lift for all item pairs
Using SQL or a dataframe library like pandas, generate a self-join of the transaction table. Each row in the resulting table represents a product pair and its basket co-occurrence count. Then compute:
- Support = (baskets containing A and B) / (total baskets)
- Confidence (A → B) = (baskets containing A and B) / (baskets containing A)
- Lift = Confidence (A → B) / (Support of B)
Market-basket analysis identifies the most valuable cross-sell pairs using exactly these metrics. The math is straightforward; the discipline is in applying appropriate thresholds.
Step 3: Filter and rank candidate pairs
Raw output will contain hundreds of thousands of pairs. Most are noise. Apply minimum support thresholds (e.g., at least 50 co-purchases) and minimum lift thresholds (e.g., lift > 1.5) to keep only meaningful pairings. Then rank surviving pairs per trigger product by confidence, descending.
Step 4: Choose between co-purchase frequency and PMI
Pointwise Mutual Information (PMI) is an alternative scoring approach that corrects for extremely popular products that appear in many baskets by chance. Ranking by conditional co-purchase frequency or PMI increases interpretability when selecting candidate complements per trigger product. The table below compares both:
| Approach | Strengths | Weaknesses | Best for |
|---|---|---|---|
| Co-purchase frequency | Simple, fast, easy to explain | Biased toward high-volume SKUs | Small to mid-size catalogs |
| Confidence | Standard, widely accepted | Still skewed by popular items | General-purpose |
| Lift | Corrects for item popularity | Noisy with low support pairs | Large catalogs with rare items |
| PMI | Strongest statistical signal | Requires more computation | Advanced / technical teams |
Step 5: Build a SQL prototype
A working prototype doesn’t need a recommendation microservice. A simple pre-computed lookup table, refreshed weekly via a scheduled query, is enough to validate your logic. Each row stores: trigger SKU, recommended SKU, confidence score, and lift. Your storefront queries this table at render time.
Step 6: Move to production
Once the prototype proves its value via A/B test, align your engineered features with business outcomes. See step-by-step cross-sell strategies and improving cross-sell with data for frameworks on bridging the gap between data science output and the metrics your merchandising team actually tracks.
You’ll want your production pipeline to handle catalog updates gracefully, auto-retire discontinued SKUs from recommendations, and surface a fallback (e.g., category bestsellers) when no association clears the threshold. Building high-converting product pages also means your cross-sell module needs to load fast and never degrade page performance.
Pro Tip: Avoid recommending a product the customer already added to their cart. Query cart state at render time and exclude those SKUs from the recommendation list.
Experimentation and placement: Improving cross-sell acceptance and performance
Once you can produce actionable recommendations, the next step is optimizing how and where they appear to maximize business impact. Getting the algorithm right is only half the battle.
Acceptance rate benchmarks by placement
Not all placements are created equal. Automated recommendations average 3.8% acceptance compared to just 1.56% for manual curation, and those rates shift significantly by touchpoint.
| Placement | Typical acceptance rate | Notes |
|---|---|---|
| Post-purchase confirmation page | 3–8% | Highest intent moment, no cart risk |
| Cart page | 2–5% | High intent but risk of cart abandonment |
| Product detail page | 1–3% | Moderate intent, competitive with PDPs |
| Email (post-purchase) | 1–3% | High volume, easy to personalize |
| Homepage | Under 1% | Low intent, rarely worth the real estate |
Post-purchase touchpoints show 3 to 8% cross-sell acceptance consistently outperforming product and cart page placements. The reason is psychological: after checkout, purchase anxiety is gone and the customer is in a receptive, satisfied state.
UX patterns that affect acceptance
- Vertical offramp: A single, prominent cross-sell offer displayed below the confirmation message. This format isolates attention.
- Horizontal carousel: Shows multiple recommendations side by side. Useful for broad catalogs but dilutes focus.
- Embedded in-cart widget: Appears within the cart summary, leveraging active shopping intent.
- Triggered modal: Appears after “add to cart,” showing one or two complementary items before the customer proceeds.
A vertical offramp navigation drove a 6.6% conversion rate lift and a 10% average transaction value increase compared to a traditional horizontal carousel. That’s a meaningful difference from a layout change alone.
What to A/B test
- Number of recommendations shown (1 vs. 2 vs. 3 products)
- Order of recommendations (confidence-ranked vs. margin-ranked vs. popularity-ranked)
- Headline copy (“Complete the look” vs. “Customers also bought” vs. “Add to your order”)
- Visual treatment (product image size, pricing display, CTA button color)
Track attach rate (how often a recommended product is added), incremental average order value (AOV), and conversion rate. Using AI optimization strategies to automate test sequencing can accelerate your learning velocity considerably. Also apply cross-sell tips for 2026 to stay aligned with current benchmarks as customer behavior evolves.
Good user experience strategies also mean not overwhelming the buyer. Two focused recommendations almost always beat six scattered ones.
Pro Tip: Run placement tests before algorithm tests. Where your recommendation appears matters more than which scoring method you use. Lock down your best placement first, then optimize the underlying model.
Advanced approaches: Context-aware and real-time recommender models
To outperform even top-performing classic approaches, consider more advanced models that personalize in real time and integrate ongoing context. Static batch models built on historical co-purchases are powerful, but they ignore what a shopper is doing right now.
Session-aware and sequential models
A session-aware model treats each browsing session as an ordered sequence of signals: pages viewed, categories explored, items added and removed. It uses this recent context to rerank or generate fresh recommendations rather than relying solely on long-term purchase history. The business benefit is clear: a customer who just spent five minutes browsing waterproof hiking boots should not receive recommendations based on the rain jacket they bought eight months ago.
Conditioning cross-sell recommendations on recent session context beyond static purchase history measurably improves relevance and attributed impressions. Even simple session signals, such as the last three product views, can add meaningful lift when incorporated into your scoring function.
Real-time contextual signals worth capturing
- Current browsing path (category and subcategory)
- Device type (mobile shoppers often prefer lower-priced add-ons)
- Time of day and day of week (weekday vs. weekend purchase intent differs)
- Cart composition at the moment of rendering
- New vs. returning visitor status
Architectural options
Two-tower neural networks have become a standard production architecture for real-time recommendation. One tower encodes item features; the other encodes user or session context. At inference time, a fast approximate nearest-neighbor search retrieves top candidates in milliseconds, enabling truly real-time personalization without sacrificing latency.
Transformer-based sequential models, popularized by architectures like BERT4Rec and SASRec, treat a session’s item sequence like a sentence and predict the next most likely “word” (product). These approaches consistently beat matrix factorization baselines on standard benchmarks. However, they require meaningful engineering investment. For most mid-sized e-commerce teams, a hybrid approach works best: batch-compute association scores weekly, then apply lightweight session-based reranking at request time.
Moving beyond batch models becomes worth the engineering cost when your catalog exceeds tens of thousands of SKUs, your transaction volume is high, or your assortment changes frequently. For smaller operations, a well-tuned analytics-fueled bundling approach built on solid market-basket analysis still delivers strong returns. For teams evaluating ad spend efficiency alongside recommendations, blended ROAS insights offer a useful framework for attributing cross-sell value holistically.
The big picture: What most get wrong about data-driven cross-sell optimization
Most teams building cross-sell systems spend the majority of their energy on model accuracy. They benchmark offline precision and recall, they debate scoring formulas, and they obsess over which algorithm outperforms another in backtesting. Then they launch, see modest lifts, and wonder what went wrong.
Here is the uncomfortable truth: the algorithm is rarely the bottleneck. Attach rate and conversion improvements don’t come just from better prediction but from touchpoint experimentation and integration with real business objectives. A mediocre algorithm on a well-placed, well-designed recommendation unit will outperform an excellent algorithm hidden in a low-visibility spot.
The second mistake is optimizing for prediction metrics instead of revenue metrics. Offline accuracy (does the model predict what the customer bought in a held-out test set?) correlates weakly with online business impact. Your real KPIs are attach rate, incremental AOV, and the effect on downstream retention. A model that is “less accurate” by offline measures but drives significantly more add-to-cart events is the better model for your business.
The third mistake is building opaque systems that your C-suite can’t validate or explain to their board. Transparent, interpretable approaches, specifically confidence and lift scores from market-basket analysis, are far easier to audit, defend, and iterate on than black-box neural networks. Executives who understand why a recommendation was made will support the program with more budget and patience. A well-documented cross-selling strategy process that ties every recommendation rule back to a business rationale will outlast any clever but unexplainable model.
Finally, cross-sell optimization is not a one-time project. The teams that compound results over time treat it as a continuous experimentation cycle: launch, measure, learn, adjust, and repeat. They keep test logs, document what failed, and build institutional knowledge. That discipline, more than any technical sophistication, separates the teams that plateau from the ones that keep growing.
Ready to accelerate your cross-sell performance?
If you’ve followed this guide, you now have a clear path from raw transaction data to a production cross-sell engine with a tested, optimized placement strategy. The next step is putting that into practice with the right analytical foundation.

Affinsy is built specifically to help mid-to-large e-commerce brands extract exactly this kind of value from their existing order data, without needing a data science team. You can explore foundational concepts like market basket analysis and product bundling strategies in our glossary, or dive into the platform to run your first association analysis on up to 20,000 line items for free, no credit card required. When you’re ready to scale, our paid plans start at $49/month. Building your cross-sell engine on a foundation of data-driven decision making is where sustainable revenue growth starts.
Frequently asked questions
What is the minimum amount of data needed to build effective cross-sell recommendations?
A robust engine typically needs several thousand unique transactions to deliver statistically reliable associations. As market-basket analysis requires large transaction sets for actionable pairings, fewer than 1,000 orders often produces too many low-support associations to be useful.
Which cross-sell metrics matter most for e-commerce?
Support, confidence, and lift are the foundational analytical metrics, while attach rate and incremental AOV reveal real business impact. Support, confidence, and lift identify the strongest product pairs, but business metrics tell you whether those pairs are actually moving the needle.
How do acceptance rates vary by recommendation placement?
Post-purchase pages consistently deliver the highest acceptance rates at 3 to 8%, while product and cart pages typically fall in the 1 to 5% range. Acceptance rates vary meaningfully by funnel position, making placement testing one of the highest-leverage optimizations you can run.
Does real-time context in recommendations truly improve performance?
Yes, empirical research confirms that session-based contextual models significantly boost relevance and attributed click rates compared to static purchase-history models. Even lightweight session signals, like the last two or three products viewed, can deliver measurable improvements over purely historical associations.
Recommended
- Smarter Sells Product Recommendations Ecommerce Guide - Affinsy Blog | Affinsy
- How to Improve Cross-Selling With Data-Driven Strategies - Affinsy Blog | Affinsy
- Proven cross-selling tips to boost e-commerce sales in 2026 - Affinsy Blog | Affinsy
- Cross Sell Strategies Step by Step for E-Commerce Growth - Affinsy Blog | Affinsy