
TL;DR:
- Purchase pattern analysis explores deeper insights into customer buying behaviors beyond basic metrics. It leverages methods like market basket, RFM, and survival analysis to optimize product bundling, timing, and retention strategies. Integrating multiple data sources and understanding channel-specific behaviors are essential for maximizing e-commerce growth.
Most e-commerce teams think they understand how their customers buy. They look at monthly revenue, top-selling SKUs, and maybe a conversion rate or two. But purchase pattern analysis goes much deeper than that. It examines when customers buy, what they buy together, how often they return, and critically, when they are about to stop buying altogether. The difference between teams that use this analysis well and those that don’t isn’t data access. It’s knowing which questions to ask and which methods actually answer them.
Table of Contents
- Key takeaways
- Core methods in purchase pattern analysis
- When and how customers actually buy
- Segmenting customers with RFM and cohort analysis
- Evolving challenges in purchase pattern analysis
- My take on purchase pattern analysis
- Analyze your purchase patterns with Affinsy
- FAQ
Key takeaways
| Point | Details |
|---|---|
| Market basket analysis drives bundling | Use support, confidence, and lift metrics to find genuine co-purchase pairs worth promoting together. |
| Timing patterns are channel-specific | Peak buying windows and platform rhythms vary significantly, so tailor campaigns to match real purchase behavior. |
| RFM segments different customer types | Recency, Frequency, and Monetary scoring lets you match marketing actions to specific customer lifecycle stages. |
| Survival analysis spots churn timing | Modeling churn as a timing problem reveals exactly when to intervene before customers go silent. |
| AI is reshaping purchase journeys | Tracking only post-click purchases misses the growing influence of AI-assisted product discovery. |
Core methods in purchase pattern analysis
There is no single technique that covers everything. The most effective purchase pattern analysis programs combine multiple methods, each answering a different question about consumer buying behavior.
Market basket analysis
Market basket analysis finds associations in transaction data by measuring how often items appear together. Three metrics do the heavy lifting here.
- Support: How frequently a specific itemset appears across all transactions. A support of 0.05 means 5% of orders include that combination.
- Confidence: The conditional probability that a customer who bought item A also bought item B. Confidence of 0.6 means 60% of buyers who purchased A also purchased B.
- Lift: The ratio of observed co-occurrence to what you would expect if the two items were purchased independently. Lift greater than 1 indicates a genuine association, not just coincidence.
Lift is the most misunderstood of the three. High confidence alone can mislead you. If a product is wildly popular, it will appear in many baskets alongside almost anything, generating high-confidence rules that mean nothing from a bundling standpoint. Lift filters out these false signals, leaving only the associations that are statistically meaningful.
Pro Tip: Always check data structure before running market basket analysis. Rules generated from single-session basket data are reliable. But if your data mixes items from different shopping sessions into one record, the co-occurrence patterns you find may reflect data architecture, not actual customer buying behavior.
Survival analysis for retention
Survival analysis answers a question most retention models ignore: not just whether a customer will churn, but when. It models each customer’s time to churn, producing two outputs. The survival rate is the probability that a customer remains active past a given point in time. The hazard rate is the instantaneous risk of churn at that moment.
Framing churn as a timing problem rather than a static yes/no classification changes your retention strategy entirely. Instead of sending win-back emails to everyone who hasn’t bought in 90 days, you can identify the exact week or month when churn risk spikes for a specific acquisition cohort and act before that threshold.
Descriptive vs. predictive vs. differential analysis
These three levels of sales pattern analysis serve different purposes. Descriptive analysis tells you what happened. Predictive analysis tells you what is likely to happen next based on historical buying behavior trends. Differential analysis compares purchase behavior across segments, time periods, or channels to surface what is different and why. Most teams stop at descriptive. The real competitive advantage lives in the predictive and differential layers.
When and how customers actually buy
Timing is one of the most underused dimensions in purchase frequency analysis. The data is clear and specific enough to drive real operational decisions.

Analysis of over one million orders from late 2024 through 2025 reveals a consistent pattern: the peak buying window runs from 8pm to 10pm local time, with Sundays and Mondays leading weekly order share. That is not a generic insight. It tells you exactly when to schedule your push notifications, when to run flash promotions, and when your fulfillment team should expect its highest volume.
Platform-specific purchase rhythms
Different channels have meaningfully different consumer spending habits, and treating them as one audience costs you revenue.
| Platform | Peak day | Peak hour window | Notable behavior |
|---|---|---|---|
| Amazon | Sunday | 8pm–10pm | Impulse and replenishment buying dominant |
| Shopify stores | Monday | 7pm–10pm | Higher AOV, more deliberate purchases |
| eBay | Sunday | 6pm–9pm | Auction end times drive late-week spikes |
| Walmart.com | Saturday | 10am–1pm | Weekend grocery and household restock |
These differences matter because they reflect different shopping motivations. A Shopify customer on Monday evening is likely in a considered buying mode. An Amazon customer on Sunday night may be clicking through recommended products. Your product presentation, pricing strategy, and email triggers should reflect those differences.
Mobile vs. desktop buying behavior
Device type adds another dimension to the picture. Mobile accounts for 72% of orders placed between 8pm and midnight. Desktop purchases are fewer in that window but convert at a higher rate. This is not a reason to deprioritize mobile. It is a reason to make sure your mobile checkout removes every possible friction point during peak hours, since you are losing a measurable percentage of that majority traffic every time the process is clunky or slow.
Seasonal digital purchase patterns add a further layer. Q4 compresses buyer timelines and inflates average order values. January sees high return rates alongside new purchase intent in fitness, organization, and learning categories. Knowing when these shifts occur lets you recalibrate your co-purchase rules and promotional bundles before the season hits rather than after.
Pro Tip: Schedule your highest-spend promotional pushes for Sunday and Monday evenings. Then audit your mobile checkout experience specifically for that window. These two actions alone can close a significant gap between traffic and revenue.
Segmenting customers with RFM and cohort analysis
Understanding aggregate customer buying patterns is useful. But the real leverage comes from understanding how different types of customers buy differently.
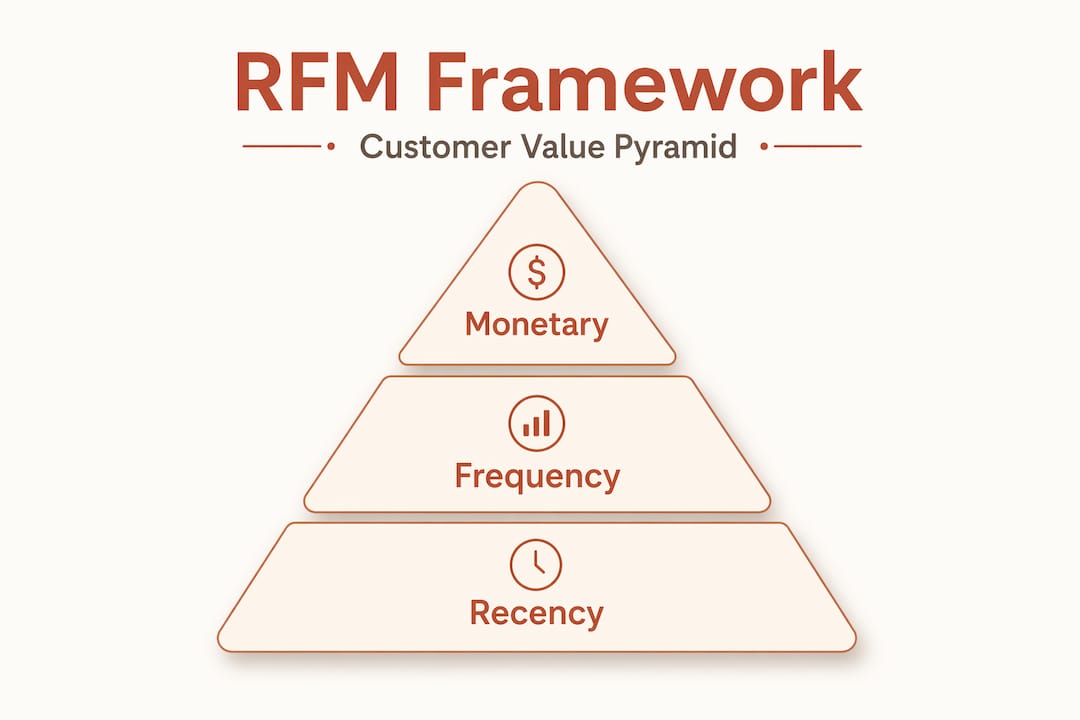
The RFM framework
RFM analysis scores every customer on three dimensions. Recency measures how recently they made their last purchase. Frequency measures how many times they have purchased. Monetary value measures how much they have spent in total. Combining these three scores creates a multidimensional view of each customer’s relationship with your brand.
The value of RFM quintile scoring is that it adapts automatically to changes in your customer mix or seasonality. You are not setting fixed thresholds that become obsolete. You are ranking customers relative to each other, which keeps your segments meaningful over time.
Typical RFM segments and corresponding marketing actions:
- Champions (high R, high F, high M): These are your best customers. Reward them with early access to new products and exclusive offers.
- Loyal customers (high F, moderate R): Strong frequency but may not be recent. Re-engage with personalized recommendations based on their purchase history.
- At-risk customers (low R, previously high F): They used to buy regularly. A targeted win-back sequence with a time-sensitive offer often reactivates this group.
- New customers (high R, low F): Recent first purchase. Focus on onboarding, education, and a cross-sell that fits their initial purchase to drive a second transaction.
- Lost customers (low R, low F, low M): Lowest priority for retention spend. If you re-engage this group, test broadly with low-cost channels before committing budget.
Cohort analysis and lifecycle hazard periods
Cohort analysis groups customers by acquisition date and tracks their behavior over time. When you layer survival analysis on top, you get something particularly useful: visibility into when churn risk spikes for customers acquired during a specific period. Survival curves by acquisition cohort reveal early high-hazard windows where many customers disengage before they ever reach a second or third purchase.
This “shakeout period” is predictable and preventable. Teams that identify it can build automated re-engagement sequences that fire at the right moment, before the hazard peak rather than after. For customer retention in e-commerce, timing your interventions to match these lifecycle hazard points is one of the highest-ROI moves available. Explore how retention strategy maps onto these patterns for practical implementation guidance.
Evolving challenges in purchase pattern analysis
Purchase pattern analysis has gotten harder, not easier, over the past two years. The core methods still work. But the environment around them is shifting in ways that affect what your data captures and what it misses.
AI’s impact on buying behavior trends
AI-assisted product discovery is reshaping purchase journeys at the research stage, not just at checkout. Customers are increasingly using AI tools to evaluate options, compare features, and narrow down choices before they ever click through to a product page. If your purchase pattern analysis only looks at what happened after the click, you are analyzing the final step in a journey that may have already been decided elsewhere.
This does not make traditional behavioral analytics obsolete. It does mean you need to track upstream signals more carefully, including search query patterns, product page entry points, and time spent on comparison-style content. The brands building this full-journey picture now will have a structural advantage as AI-assisted shopping continues to grow.
Integrating multiple data sources
Single-source analysis has real limits. Order data tells you what was purchased. Email engagement tells you what got attention. On-site behavior tells you what was considered. Combining these into a unified view of the customer journey produces far richer consumer purchase insights than any one source alone.
The practical barrier is data pipeline complexity, but the analytical payoff is significant. Dynamic models that update segment assignments in near real time, rather than in monthly batch runs, give marketing and product teams a much faster feedback loop on what is actually working.
My take on purchase pattern analysis
I’ve spent years looking at how e-commerce teams actually use purchase data, and the most common mistake I see is not a technical one. It’s a framing problem. Teams treat purchase pattern analysis as a reporting exercise rather than a decision-making system. They build dashboards, review them in meetings, and then go back to running the same campaigns they were already running.
What I’ve learned is that the analysis only creates value when it directly changes a specific decision: which products get bundled, when a retention email fires, how a product page is structured for mobile at 9pm on a Sunday. The teams I’ve seen get the most out of this work are the ones who connect each analytical output to an owner and a decision within a defined time frame.
The timing dimension is almost always underused. Most teams know their best-selling products. Very few have mapped their marketing calendar to actual peak purchase windows by channel and device type. That gap is where a lot of recoverable revenue sits.
AI complexity is real and worth taking seriously. But I’d caution against using it as an excuse to defer the fundamentals. Getting your RFM segmentation right, understanding your cohort churn hazard periods, and running clean market basket analysis on properly structured data will generate returns that are larger and faster than most teams expect.
— Mateusz
Analyze your purchase patterns with Affinsy
Knowing the theory is one thing. Having a tool that surfaces these insights from your actual transaction data is another.

Affinsy is built specifically for e-commerce professionals who want the analytical depth of market basket analysis and RFM customer segmentation without needing a data science team to run it. Upload your order data via CSV or connect through the API, and the platform surfaces co-purchase associations, segment-level buying patterns, and retention risk signals from your own history. There is a permanent free tier covering up to 20K line items with no credit card required, so you can validate the analysis against real data before committing to a paid plan.
FAQ
What is purchase pattern analysis?
Purchase pattern analysis is the process of examining transaction data to understand when, what, and how frequently customers buy. It combines methods like market basket analysis, RFM segmentation, and survival analysis to produce insights that inform product strategy, marketing timing, and customer retention.
How does lift differ from confidence in market basket analysis?
Confidence measures the conditional probability that item B is purchased when item A is. Lift adjusts for item popularity, so a lift above 1 confirms a genuine association rather than a pattern driven by one item’s high overall frequency.
When is the best time to send e-commerce promotions?
Based on analysis of over one million orders, the peak purchase window is 8pm to 10pm local time, with Sundays and Mondays generating the highest order share. Scheduling promotions around these windows typically improves engagement and conversion rates.
What is an RFM segment and how is it used?
An RFM segment groups customers by Recency, Frequency, and Monetary scores to reflect their current relationship with your brand. Each segment maps to a different marketing action, from loyalty rewards for Champions to win-back sequences for At-Risk customers.
How does survival analysis improve customer retention?
Survival analysis models churn as a timing problem, identifying the specific weeks or months when churn risk peaks for a given customer cohort. This lets retention teams intervene before the hazard period rather than reacting after customers have already gone quiet.
Recommended
- Guide to E-Commerce Data Analysis for Increased Sales - Affinsy Blog | Affinsy
- Ecommerce Analytics Trends 2026: Unlocking Growth Through AI - Affinsy Blog | Affinsy
- Sales pattern analysis: maximize e-commerce growth - Affinsy Blog | Affinsy
- E Commerce Analysis Report Guide for 2025 Success - Affinsy Blog | Affinsy