
TL;DR:
- Improving customer retention through repeat purchase rate insights can quickly boost profitability and forecast growth. Focusing on post-purchase experience, targeted re-engagement, and segmentation offers tangible results without relying heavily on discounts. Tracking customer-level repeat purchases with proper metrics provides a clear early warning signal for retention and growth opportunities.
A repeat purchase happens when a customer places a second (or later) order from the same brand. The metric that tracks this at scale is the Repeat Purchase Rate (RPR): divide the number of customers with two or more orders by your total unique customers in a defined window, then multiply by 100. That single number tells you more about retention health than almost any other metric you can pull in a single quarter. If yours is low, the first place to look is post-purchase experience, not acquisition spend.
A small improvement in customer retention can substantially boost profits, with the exact impact varying widely depending on your margins and category mix. That range is wide because it reflects real differences across verticals, but the direction is consistent: small retention gains compound fast.
Start by calculating your RPR on a 90-day or 365-day window, document the window you choose, and run it by cohort so you can see whether newer customers are returning at the same rate as older ones. Affinsy’s RFM segmentation and market-basket analysis can compress that analysis from days to minutes once your transaction data is loaded.
Table of Contents
- What exactly is a repeat purchase?
- Why repeat purchases drive profitable growth
- How do you calculate repeat purchase rate?
- Which tactics actually move repeat purchase rate?
- How to analyze your transaction data for repeat-purchase opportunities
- How to segment customers by repeat purchase behavior
- What role does customer feedback play in repeat buying?
- Key Takeaways
- The discount trap is costing you more than you think
- Affinsy turns your transaction data into a repeat-purchase roadmap
- Useful sources for deeper reading
What exactly is a repeat purchase?
Repeat purchase is the act of a customer buying from the same brand more than once. You will see it labeled differently depending on the tool or report: repeat buyer, repeat customer, repurchase, reorder, or reorder rate. They all point at the same behavior, but the framing matters. Customer-level counting is the correct approach. Order-level metrics inflate the signal because heavy buyers skew the average upward, making loyalty look stronger than it is across your full base.
How repurchase cycles differ by product type:
- Consumables (supplements, coffee, skincare): natural reorder windows of 30–90 days; high RPR is expected and achievable.
- Apparel and footwear: seasonal cycles; RPR is meaningful but lower, driven by new drops and fit satisfaction.
- Electronics and durables: long replacement cycles; a second purchase often means a complementary product, not a replacement.
- Subscriptions: RPR is structurally high because the mechanism forces recurrence; the real signal is whether subscribers upgrade or add one-time purchases.
Common measurement mistakes to avoid:
- Counting orders instead of customers (inflates RPR for brands with a small group of heavy buyers).
- Including refunded or cancelled orders in the numerator.
- Mixing different time windows across reporting periods, which makes trend lines meaningless.
- Treating a subscription renewal as a “repeat purchase” when the customer never made an active choice to reorder.
Recognizing which synonym your analytics platform uses matters because some tools default to order-level repeat share. Always confirm the denominator before you trust the number.
Why repeat purchases drive profitable growth
RPR is the earliest leading indicator for lifetime value. LTV cohorts take 12–24 months to mature; RPR gives you a usable signal inside a single quarter. That timing advantage is what makes it the right metric to put in front of a board or finance team when you need to argue for retention investment before the LTV data is conclusive.

The unit economics argument is straightforward. If your RPR is low, every dollar you spend on acquisition is funding a leaky bucket. Customer acquisition costs have risen sharply across paid channels, and a customer who buys once and disappears generates no margin contribution beyond that first transaction. A customer who buys three times, on the other hand, typically costs nothing incremental to retain and often spends more per order over time.
Here is a simple worked example. Suppose you have 10,000 customers and a current RPR of 20%. That means 2,000 customers have placed a second order. If your average second-order revenue is $85, your repeat-customer revenue is $170,000. Move RPR to 30% through targeted post-purchase flows and replenishment campaigns, and that figure rises to $255,000 from the same customer base, with no additional acquisition spend. A 10-point RPR lift on a mid-size brand is not a rounding error.
RPR belongs in stakeholder reporting as the earliest warning sign, sitting above LTV and churn in the reporting hierarchy. When RPR drops two or three points quarter-over-quarter, it signals a post-purchase or product-satisfaction problem before it shows up in churn or LTV data. That lead time is the whole point.
How do you calculate repeat purchase rate?
The canonical customer-level formula:
The numerator counts distinct customer IDs with at least two completed, non-refunded orders within the window. The denominator counts every unique customer who placed at least one order in the same window. Exclude cancelled and refunded orders from both counts to avoid inflating the rate.
Worked example:
- Total unique customers in a 365-day window: 2,000
- Customers with 2 or more completed orders: 600
- RPR = (600 ÷ 2,000) × 100 = 30%
That 30% means roughly one in three customers came back for a second order within the year. Whether that is good depends entirely on your vertical.
Choosing the right measurement window
A 90-day window suits consumables and fast-moving categories where reorder cycles are short. It gives you a faster feedback loop for testing. A 365-day window is more appropriate for apparel, home goods, and considered purchases where the natural repurchase cycle is longer. The critical rule: pick one window, document it, and freeze it for reporting. Switching windows mid-year destroys trend comparability.
RPR vs. retention rate vs. repeat-order share
These three metrics are often confused:
| Metric | What it measures | Level | Best used for |
|---|---|---|---|
| Repeat Purchase Rate | % of customers who bought 2+ times | Customer | Loyalty and retention health |
| Retention Rate | % of customers who return in a later period | Customer | Cohort survival over time |
| Repeat-Order Share | % of orders placed by returning customers | Order | Revenue mix reporting |
RPR is the preferred signal for loyalty because it is customer-level and responds quickly to tactical changes.
Benchmarks by vertical
| Vertical | Typical RPR range |
|---|---|
| Subscription e-commerce | 50%+ |
| Consumables (health, beauty, food) | 30–50% |
| Apparel and footwear | 20–30% |
| Home goods and furniture | 15–20% |
| Luxury goods | 10–15% |
| Consumer electronics | 10–20% |
If your RPR sits below the low end of your vertical’s range, the gap is almost always explained by one of three things: poor post-purchase experience, mis-timed re-engagement, or a product-market fit issue with first-time buyers.
Which tactics actually move repeat purchase rate?
Focused post-purchase email and SMS flows and targeted replenishment campaigns can measurably improve repeat purchase rate within a quarter. That is the realistic short-term ceiling for most brands, and it comes almost entirely from the first three tactics below.
-
Post-purchase confirmation and onboarding flow. The 48 hours after an order ships is the highest-engagement window you will ever have with a new customer. A sequence that confirms the order, sets delivery expectations, and introduces a complementary product or usage tip outperforms any re-engagement email sent weeks later. Failure mode: sending a generic “thanks for your order” with no next step.
-
Replenishment reminders timed to the product lifecycle. Reminders timed to a cohort-derived reorder window outperform fixed calendar emails. Pull the median days-to-reorder for each SKU from your transaction data and trigger the reminder at that interval, not at an arbitrary 30-day mark. Failure mode: using the same send cadence for a 30-day supplement and a 90-day moisturizer.
-
Subscribe-and-save or auto-replenishment. Converting a one-time buyer to a subscription removes the friction of the reorder decision entirely. Even a modest subscription conversion rate on your top consumable SKUs can move RPR measurably. Failure mode: burying the subscription option below the fold on the product page.
-
Loyalty mechanics. Points, tiers, and early access work when the reward is visible and attainable within two or three orders. Programs that require 10 purchases before any reward lands tend to see low engagement. Failure mode: a points balance the customer never checks because there is no reminder.
-
Personalized product recommendations. Recommendations driven by purchase history and market-basket associations outperform bestseller lists for returning customers. A customer who bought a French press does not need to see another French press; they need to see the burr grinder or the descaling tablets. Failure mode: serving the same homepage recommendations to first-time and fifth-time buyers.
-
Bundling and cross-sell at checkout. Surfacing a frequently-bought-together pair at checkout increases AOV on the first order and plants the seed for the second. Failure mode: recommending unrelated products based on category rather than actual co-purchase data.
-
Post-purchase support experience. A customer who contacts support and gets a fast, satisfying resolution is more likely to reorder than one who never contacts support at all. Failure mode: treating support as a cost center with no connection to retention metrics.
-
Referral incentives. Referral programs work best as a retention tool when the referrer receives a reward tied to their next purchase, not just a discount code for a friend. Failure mode: one-sided referral programs that reward the new customer but not the advocate.
Quick A/B test template for any of the above:
- Hypothesis: Sending a replenishment reminder at the cohort-derived reorder window (vs. day 30) will increase 90-day RPR by at least 2 points.
- Variant setup: Control = day-30 email; Test = email triggered at median days-to-reorder per SKU.
- Sample size: Aim for at least 500 customers per arm to detect a 2-point RPR difference with reasonable confidence.
- Primary metric: 90-day RPR. Secondary metrics: repeat-customer revenue share, AOV on second order.
- Success criteria: RPR lift of 2+ points, no degradation in unsubscribe rate.
How to analyze your transaction data for repeat-purchase opportunities
Data requirements before you start
Before any analysis, confirm you have: customer IDs that persist across orders, order timestamps, SKU-level line items, order status flags (to exclude refunds and cancellations), and a clean mapping of SKUs to product categories. Common ETL issues to check: duplicate order IDs from platform exports, guest checkouts with no persistent ID, and refund records that appear as negative orders rather than status flags.
Step-by-step workflow
Step 1: Cohort pull. Group customers by their first-order month. For each cohort, calculate RPR at 90 days and 365 days. This immediately shows whether newer cohorts are returning at lower rates than older ones, which is the most common early warning sign.
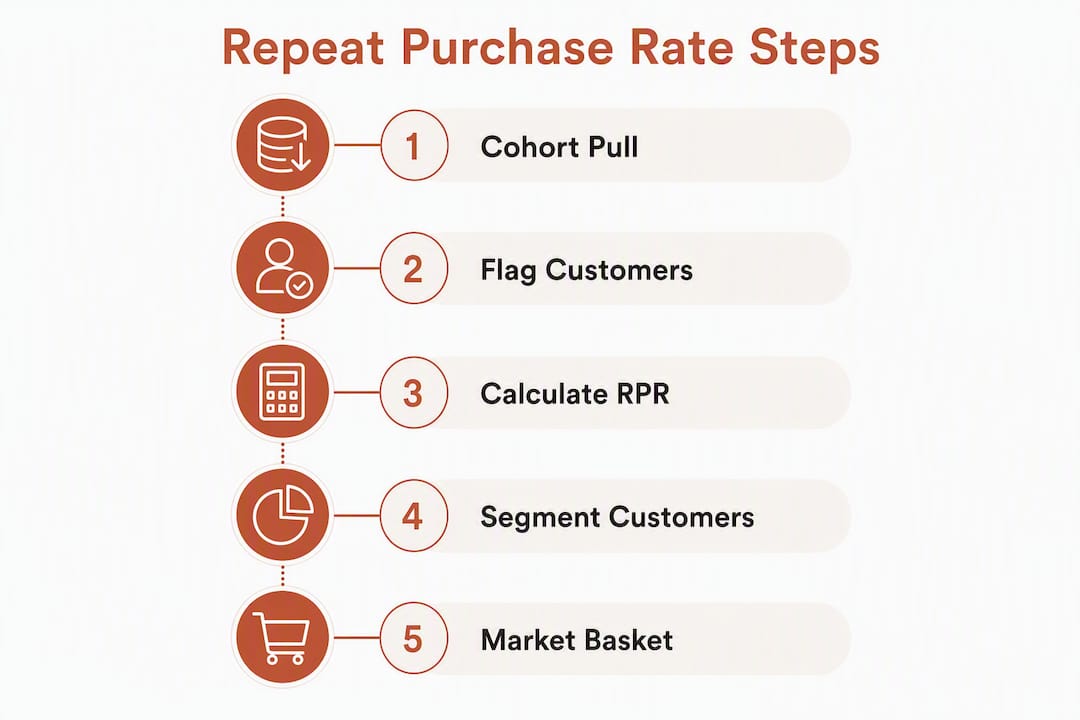
Step 2: Customer-level RPR by cohort. Flag every customer with 2+ orders. Calculate RPR per cohort. Plot it. A declining trend across recent cohorts points to a post-purchase or product issue; a flat trend with low absolute RPR points to a re-engagement timing problem.
Step 3: RFM segmentation. Score customers on Recency, Frequency, and Monetary value. Customers with high recency and frequency are your best candidates for subscription or loyalty upsell. Customers with high recency but low frequency are your replenishment targets. Customers with low recency and previously high frequency are your win-back segment.
Step 4: Market-basket analysis (MBA). Run association rules on your transaction data to find SKU pairs that are frequently purchased together. RFM segmentation combined with market-basket analysis surfaces the highest-lift targets: customers with strong recency and frequency who also bought one product in a high-lift pair are prime candidates for a cross-sell or bundle offer.
Step 5: Action mapping. Match each segment to a tactic. High-RFM customers with a top replenishment SKU get a subscription offer. High-recency, low-frequency customers get a timed replenishment reminder. At-risk first-time cohorts get a win-back sequence with a usage tip rather than a discount.
Three highest-priority outputs to act on immediately:
- Top refill SKUs by median reorder window (for subscription test)
- Highest-lift cross-sell pairs from MBA (for bundle or checkout recommendation)
- First-time cohorts with RPR below vertical benchmark (for post-purchase flow audit)
Pro Tip: Before running MBA, filter out SKUs with fewer than 50 orders. Low-volume items produce spuriously high lift scores that look compelling but don’t hold up at scale.
How to segment customers by repeat purchase behavior
Segmentation by repurchase behavior is where RPR moves from a reporting metric to a targeting tool. The goal is to route each customer into the right message at the right time, not to send the same retention email to your entire list.
The most useful segments for retention marketing are:
One-time buyers (RPR = 0 in window): your largest opportunity. Divide this group by days-since-first-order. Customers within 60 days of their first purchase are still in the consideration window; customers beyond 180 days need a stronger re-engagement hook.
Two-time buyers: often the most underserved segment. A customer who has placed exactly two orders has demonstrated intent but has not yet formed a habit. A targeted sequence that acknowledges their loyalty and surfaces a third relevant product can convert a casual buyer into a regular.
High-frequency buyers (3+ orders): protect this segment above all others. They are your most margin-efficient customers. Prioritize them for early access, loyalty rewards, and proactive support outreach. Losing one high-frequency buyer costs more than acquiring three new ones.
Lapsed buyers (previously active, no order in 90–180+ days): win-back campaigns work best when they lead with something new (a product launch, a reformulation, a seasonal drop) rather than a discount. A discount trains lapsed customers to wait for the next one.
Exporting these segments to your email or SMS platform (Klaviyo, Omnisend, MailerLite) is where the analysis becomes revenue. The segment definition is only as useful as the speed with which you can get it into a campaign. AI-driven customer segmentation shortens that path considerably when your data is structured and current.
What role does customer feedback play in repeat buying?
Feedback is a retention signal that most brands underuse. A post-purchase survey sent 7–14 days after delivery does two things simultaneously: it tells you why customers did or did not reorder, and it reminds the customer that the brand is paying attention. That reminder alone has a measurable effect on return intent.
The most useful questions to ask are not about satisfaction scores. Ask: “What would make you more likely to order again?” and “Was there anything about the product or delivery that surprised you?” Open-ended responses surface friction points that no analytics dashboard will show you, including packaging issues, confusing instructions, and unmet expectations set by product copy.
Negative feedback handled well is a retention opportunity. A customer who reports a problem and receives a fast, personal response is often more loyal than one who had a flawless experience. The act of resolution creates a relationship that a smooth transaction never does.
Connect feedback data to your RPR cohorts. If customers who submitted a complaint in month one have a lower 90-day RPR than those who did not, your support resolution process needs work. If customers who completed a post-purchase survey have a higher RPR than those who did not, the survey itself is functioning as a re-engagement touchpoint, and you should expand its reach.
Personalized reorder reminders and easy access to order history are more effective retention tools than generic discounts, and feedback loops feed directly into the personalization signals that make those reminders relevant.
Key Takeaways
Repeat purchase rate is the fastest actionable proxy for lifetime value, and a focused 90-day effort on post-purchase flows, replenishment timing, and RFM-driven segmentation can move it 3–6 points without increasing acquisition spend.
| Point | Details |
|---|---|
| Use the customer-level formula | RPR = customers with 2+ orders ÷ total unique customers × 100; never count at the order level. |
| Benchmark against your vertical | Subscription brands target 50%+; luxury and durables typically land at 10–20%. |
| Fix post-purchase experience first | Poor post-purchase flows are the most common cause of low RPR and the fastest to fix. |
| Combine RFM and market-basket analysis | Routing segments to the right tactic (replenishment vs. cross-sell vs. win-back) multiplies impact. |
| Affinsy accelerates the workflow | Affinsy’s MBA and RFM tools surface cross-sell pairs and exportable segments from your transaction data. |
The discount trap is costing you more than you think
The conventional wisdom on repeat purchase improvement goes something like this: run a loyalty program, offer a discount on the second order, and watch RPR climb. It works, technically. The problem is what it costs you and what it trains your customers to expect.
Brands that rely on discounts to drive repurchases often find themselves in a margin spiral. The customers who respond to a 15%-off second-order coupon are disproportionately price-sensitive. They will wait for the next coupon before placing a third order. Over time, you have not built a loyal customer base; you have built a discount-dependent one. Your RPR looks healthy in the dashboard, but your contribution margin tells a different story.
The more durable approach is to make the product experience itself the reason to return. That means investing in the post-purchase touchpoints that most brands treat as operational overhead: the shipping confirmation, the unboxing, the first-use instruction, the 14-day check-in. None of these cost what a 15% discount costs, and none of them erode the perceived value of your product.
The practical warning: before you launch any retention campaign, calculate the margin impact of the incentive you are planning to offer. If the discount required to move RPR 2 points costs more than the incremental revenue those returning customers generate, you are paying for a metric, not for growth. Use behaviorally triggered content, usage tips, and timed replenishment reminders instead. They work on the customers most likely to return anyway, and they do not train the rest to wait.
Affinsy turns your transaction data into a repeat-purchase roadmap
Most e-commerce teams already have the data they need to move RPR. What they lack is the time to run cohort pulls, RFM scores, and market-basket analysis before the quarter ends.
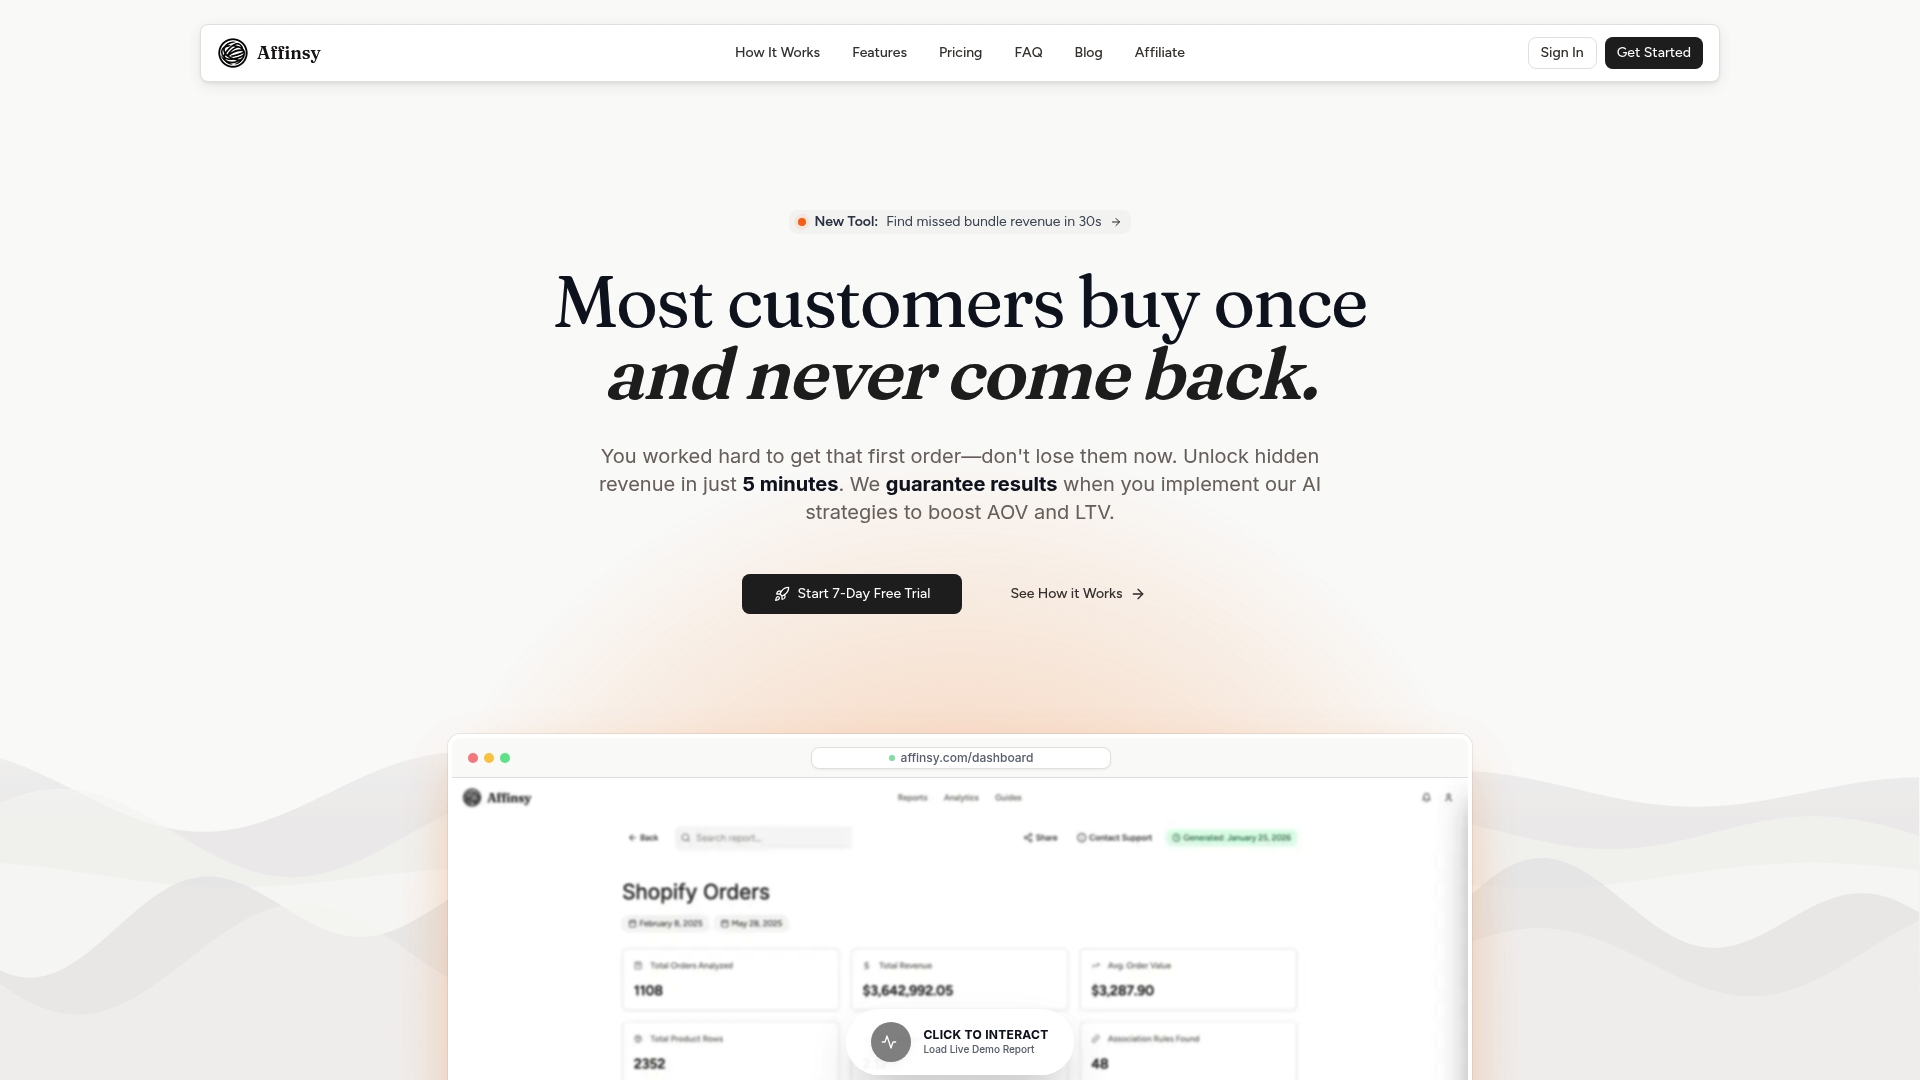
Affinsy compresses that workflow. Upload your order data via CSV or connect through the API, and the platform surfaces your highest-lift cross-sell pairs, RFM segments, and replenishment windows in a single dashboard. Segments export directly to Klaviyo, Omnisend, or MailerLite, so the path from analysis to live campaign is measured in hours, not sprints. The free tier covers up to 20,000 line items with full product access and no credit card required. If your dataset is larger, Pro starts at $49/month.
The workflows in this guide, from cohort RPR to RFM-driven segmentation to MBA cross-sell discovery, are exactly what Affinsy is built to run. Start with a free account and load your last 90 days of transaction data to see which segments and SKU pairs are worth acting on first.
Useful sources for deeper reading
-
Repeat Purchase Rate: The Customer-Level Formula Most Brands Get Wrong — The clearest explanation of why customer-level RPR outperforms order-level repeat share, with guidance on numerator/denominator rules. Use this when you need to defend your measurement methodology internally.
-
Repeat Purchase Rate: Formula & Benchmarks — Vertical benchmark ranges and a breakdown of the most common causes of low RPR. Use this for benchmarking your current rate against category norms.
-
Repeat Purchase Rate: Formula, Benchmarks & How to Improve — Covers the timing advantages of RPR as an LTV proxy and includes practical guidance on avoiding margin-eroding discount strategies. Use this for strategy and expectation-setting with stakeholders.
-
Repeat Purchase Definition (Emarsys) — A concise glossary definition with notes on personalization and reorder reminders as retention levers. Use this as a reference when aligning terminology across teams.
-
Repeat Sales: Meaning & Measurement (Investopedia) — Covers the halo effect of repeat customers on AOV and margin. Use this when building the business case for retention investment with a finance audience.
-
Repeat Order Definition (Cambridge English Dictionary) — The standard definition of a repeat order for glossary alignment and terminology consistency across reports.