
TL;DR:
- Shopping behavior analysis helps identify customer friction points to improve e-commerce performance. It combines quantitative metrics and qualitative signals to reveal why shoppers abandon carts. Prioritizing fixes using the ICE framework and validating product associations with lift scores enhances revenue growth.
Shopping behavior analysis is the systematic examination of shopper interactions and decisions to improve e-commerce performance and customer engagement. The average cart abandonment rate sits at 70.19%, meaning nearly 7 out of 10 shoppers leave without buying. That number, tracked by Baymard Institute across more than a decade of research, defines the scale of the problem. The most effective shopping behavior analysis tips combine hard metrics with qualitative signals, behavioral segmentation frameworks like Impact × Confidence × Effort (ICE), and techniques such as Market Basket Analysis (MBA) to reveal not just what shoppers do, but why they do it.
1. Which metrics and behavioral signals matter most
The metrics that drive real decisions fall into two categories: quantitative and qualitative. Quantitative metrics include cart abandonment rate, add-to-cart ratio, checkout completion rate, and average order value. Qualitative signals include hesitation points, chatbot transcripts, support tickets, and session replays. Combining both data types reveals the “why” behind shopper actions that purely numeric reports miss entirely.
Quantitative signals to track:
- Cart abandonment rate (benchmark: 70.19%)
- Add-to-cart ratio by product category
- Checkout completion rate per device type
- Average order value by customer segment
- Page exit rate at each funnel step
Qualitative signals to track:
- Session replay footage showing hesitation and backtracking
- Chatbot transcripts flagging repeated objections
- Support ticket themes tied to specific product pages
- Post-purchase survey responses about friction
Behavioral analytics identifies friction by observing hesitation times, error rates, scroll patterns, and user backtracking. That level of detail goes far beyond what aggregate dashboards show. A checkout completion rate of 60% tells you there is a problem. A session replay showing users pausing at the shipping cost field tells you exactly where to fix it.
Pro Tip: Monitor micro-metrics like field-level abandonment rates inside your checkout form. A single confusing field can suppress completions across thousands of sessions without appearing in top-level funnel reports.

2. How to segment and prioritize shopper behaviors
Behavioral segmentation by action pattern outperforms demographic targeting for conversion strategy. Action-based segmentation using click paths, hesitation signals, and repurchase cadence gives you groups that actually behave differently, not just groups that look different on paper. Age and location tell you who your shoppers are. What they click, where they pause, and when they return tells you what they intend to do.
Start by splitting your audience into three core behavioral groups:
- Product page abandoners. These shoppers viewed products but never added to cart. Their friction is at the awareness or consideration stage, not checkout.
- Cart abandoners. These shoppers added items but left before initiating checkout. Price comparison, distraction, or shipping cost surprises typically drive this group.
- Checkout initiators. These shoppers started checkout but did not complete it. This group is closest to purchase and yields the highest revenue uplift per fix.
Once you have your segments, prioritize fixes with the ICE framework: score each potential improvement by Impact (revenue effect), Confidence (evidence strength), and Effort (development cost). Multiply the three scores and rank your backlog. This prevents teams from spending weeks on low-impact polish while high-value checkout fixes wait.
Pro Tip: Tailor your UX research method to each segment. Product page abandoners respond well to on-site polls. Cart abandoners are better studied through exit-intent surveys. Checkout initiators reveal the most through session replay review.
Avoid building your entire analysis around demographic filters. A 35-year-old parent and a 35-year-old professional may share the same zip code but show completely different behavioral shopping patterns on your site. Behavior is the signal. Demographics are just context.
3. How advanced techniques like Market Basket Analysis deepen insights
Market Basket Analysis (MBA) is a technique that identifies which products shoppers buy together by analyzing transaction records. The two core metrics are support (how often a product pair appears in orders) and lift (how much more likely two products are to be bought together compared to chance). Lift metrics validate true product associations beyond raw frequency, preventing misleading conclusions from high-volume but coincidental pairings.
A product that appears in 40% of orders has high support. But if it appears in 40% of all orders regardless of what else is in the cart, its lift score is 1.0, meaning no real association exists. A product pair with 8% support and a lift of 3.2 is far more useful for cross-sell targeting. Always read lift alongside support before acting on MBA output.
The table below shows the main methods used in consumer behavior analysis, with their primary strengths and key limitations.
| Method | Primary strength | Key limitation |
|---|---|---|
| Market Basket Analysis | Uncovers product co-purchase patterns | Requires clean transaction data at scale |
| Session replay analysis | Shows exact friction points in real time | Time-intensive to review at volume |
| RFM segmentation | Ranks customers by recency, frequency, value | Does not explain why behavior occurs |
| NLP on chat transcripts | Surfaces psychological objections at scale | Requires text preprocessing and tagging |
| Real-time behavioral sensing | Adapts offers to in-session context | High implementation complexity |
A 2026 review of 127 peer-reviewed studies confirms that leading businesses now integrate transaction-based modeling, content-based psychological inference, and real-time context sensing together. No single method gives a complete picture. The combination is what produces accurate predictions.
Pro Tip: Before acting on any MBA output, check lift scores for every product pair. Use Affinsy’s support and lift metrics to filter associations with lift below 1.5, which signals a weak or coincidental pairing.
4. What common pitfalls undermine shopping behavior analysis
The most expensive mistake in consumer behavior analysis is treating all cart abandonment as a checkout friction problem. Checkout friction accounts for less than one-third of abandonment. The majority of abandonment drivers sit earlier in the funnel or inside the shopper’s psychology, not inside your checkout form. Fixing form fields while ignoring product page trust signals or pricing transparency will produce minimal results.
A second common mistake is asking shoppers directly why they left. Direct “why” questions produce rationalized, socially acceptable answers rather than honest ones. Reconstructing the shopper’s journey narratively, by asking what they were trying to accomplish and what happened next, surfaces authentic psychological triggers that direct questioning misses.
Pricing transparency is a third area where teams consistently underinvest. Unexpected shipping costs account for 28–35% of all cart abandonment sessions, making them the single largest abandonment driver in 2026. Showing total cost, including shipping and taxes, before the final checkout step removes the surprise that causes most late-stage drop-off.
Practical tips to strengthen your analysis:
- Show shipping costs on product pages, not only at checkout
- Use session replays to identify the exact field or step where users stop
- Cross-reference support ticket themes with funnel drop-off points monthly
- Run exit-intent surveys on cart and checkout pages separately
- Reconstruct shopper journeys in user interviews rather than asking direct “why” questions
- Validate MBA product pairs with lift scores before building cross-sell campaigns
- Score your fix backlog with ICE before each sprint to protect team capacity
- Review purchase pattern trends quarterly to catch seasonal behavioral shifts early
Qualitative data from customer conversations illuminates reasoning that analytics can only partially reveal. Pairing a session replay showing a user abandoning at the shipping field with a support ticket saying “I didn’t expect that cost” gives you both the what and the why in the same breath. That combination is where the most reliable fixes come from.
Key Takeaways
Effective shopping behavior analysis requires combining quantitative metrics, qualitative signals, behavioral segmentation, and validated analytical techniques to produce fixes that actually lift revenue.
| Point | Details |
|---|---|
| Cart abandonment benchmark | The average rate is 70.19%; use it as your baseline to measure improvement. |
| Segment by behavior, not demographics | Action patterns like click paths and hesitation signals predict conversion better than age or location. |
| Validate MBA with lift scores | A product pair with high support but lift near 1.0 signals a coincidental, not causal, association. |
| Prioritize fixes with ICE | Score improvements by Impact, Confidence, and Effort before committing development resources. |
| Show costs early | Unexpected shipping costs drive 28–35% of abandonment; display total cost before the final checkout step. |
Why behavioral depth beats dashboard breadth
I’ve spent years watching e-commerce teams pull weekly dashboards and walk away with the same conclusion: “We need to reduce cart abandonment.” The dashboard confirms the problem. It almost never explains it.
The shift that actually moves revenue is moving from metrics to hypotheses. When you stop asking “what is our abandonment rate?” and start asking “why do shoppers who add two or more items abandon at a higher rate than single-item shoppers?”, you get somewhere. That question leads to a session replay review, which leads to a specific friction point, which leads to a fix you can test in a week.
Demographic segmentation has the same problem. Knowing that your top abandoners are women aged 25–44 gives you a targeting bucket, not a behavior to change. Knowing that shoppers who view your return policy page convert at twice the rate of those who don’t gives you a test: make the return policy more visible. One of those insights requires a media buy. The other requires a CSS change.
The ICE framework changed how I think about prioritization. Later-stage checkout frictions yield higher revenue uplift per fix because the shopper is already committed. Fixing a confusing address field beats redesigning your product page hero image almost every time, even if the hero image looks worse. Effort matters as much as impact when your team has finite sprints.
The hardest lesson is that shopper psychology keeps changing. What caused abandonment in 2023 is not what causes it now. Conversion rate optimization is not a project you finish. It is a practice you maintain. Teams that treat it as a one-time audit fall behind teams that run continuous behavioral research as a standing function.
— Mateusz
Affinsy turns transaction data into behavioral insight
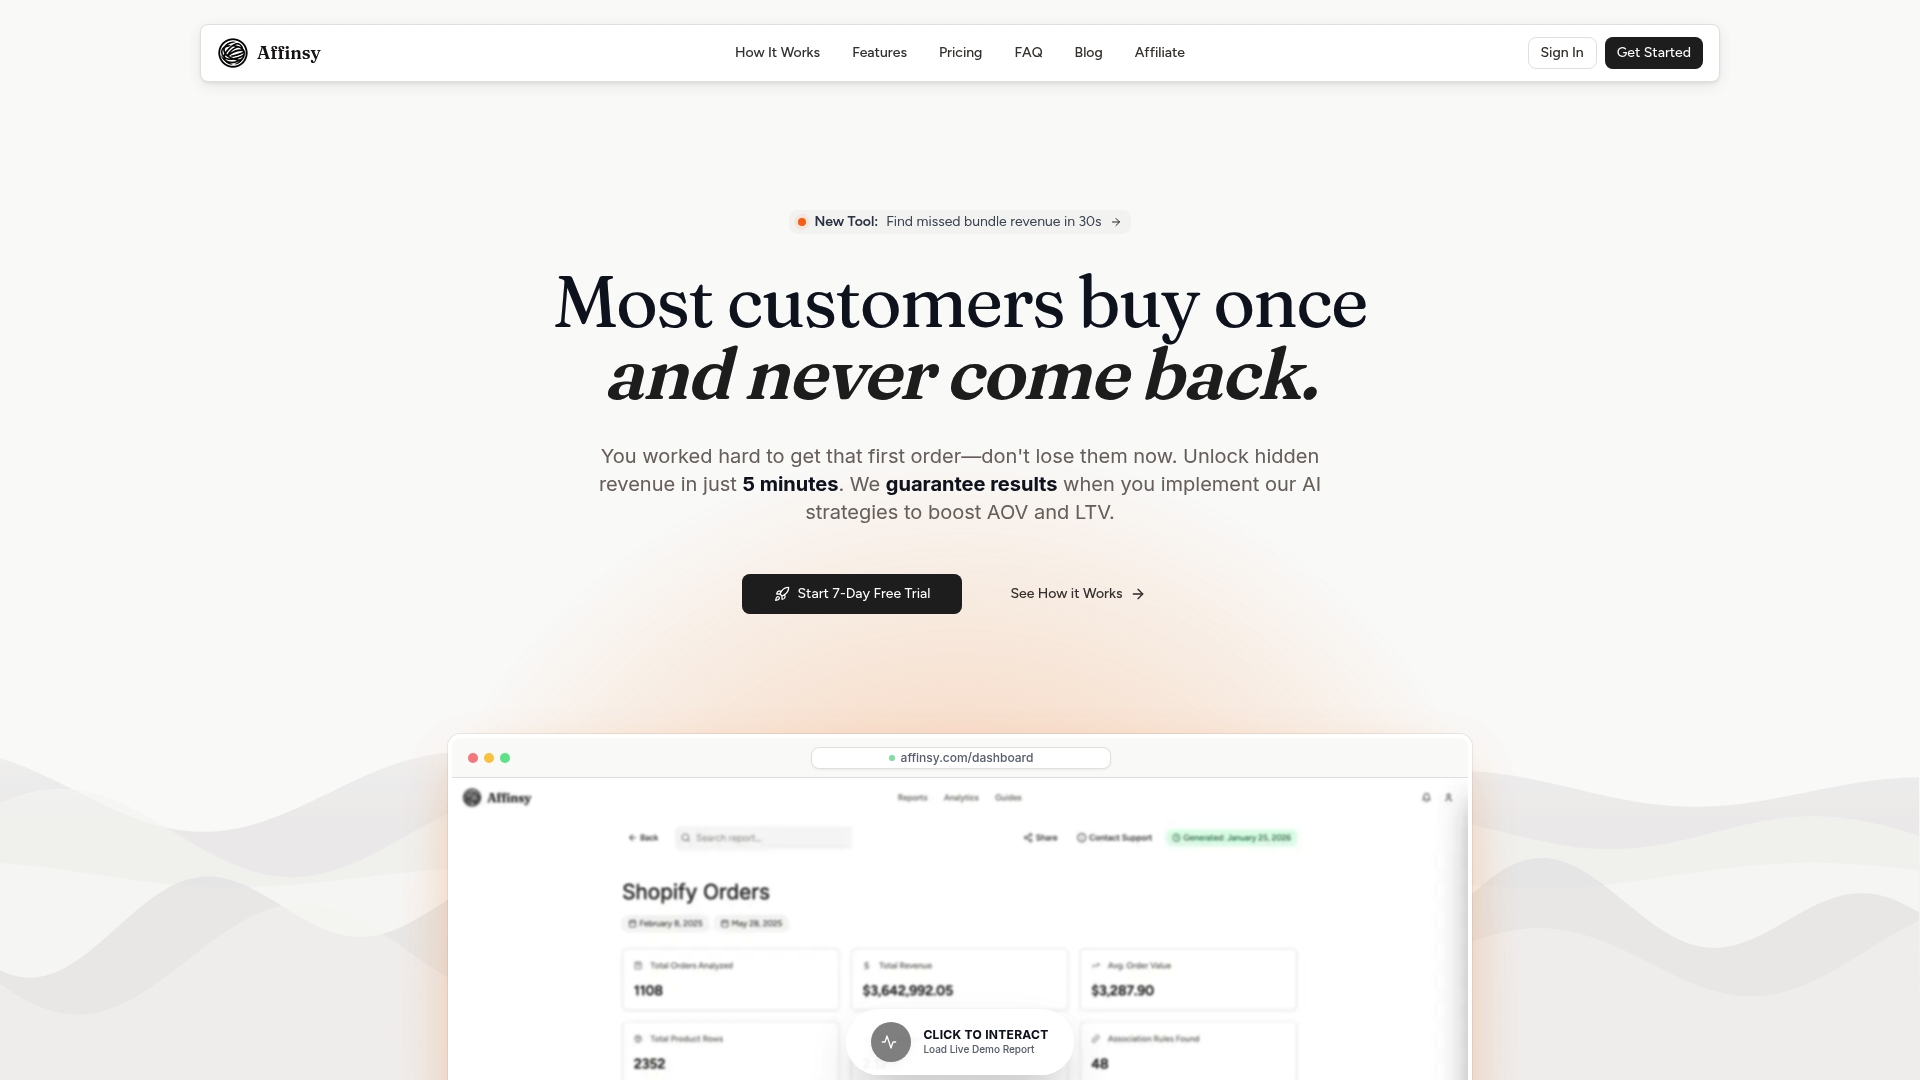
Affinsy analyzes your historical order data to surface the product associations and customer segments that drive your revenue. Upload a CSV from Shopify, WooCommerce, BigCommerce, or any platform that exports transaction records, and Affinsy runs Market Basket Analysis and RFM customer segmentation automatically. No data science skills required. The free tier covers up to 20K line items with full product access and no credit card needed. Pro plans start at $49/mo for larger datasets and API access. If you want to know which products your best customers buy together and which segments are at risk of churning, Affinsy gives you both answers from the data you already have.
FAQ
What is shopping behavior analysis?
Shopping behavior analysis is the systematic study of how customers interact with a store, from product discovery through purchase or abandonment, to identify friction points and improve conversion rates.
What is the average cart abandonment rate?
The average online cart abandonment rate is 70.19%, based on more than a decade of research compiled by Baymard Institute. That figure makes cart abandonment one of the highest-leverage areas for e-commerce improvement.
What causes the most cart abandonment?
Unexpected shipping costs account for 28–35% of cart abandonment sessions, making them the leading single cause of checkout drop-off in 2026. Displaying total cost before the final checkout step directly reduces this type of abandonment.
What is the ICE framework in e-commerce analysis?
ICE stands for Impact, Confidence, and Effort. Teams score each potential fix on all three dimensions, multiply the scores, and rank their backlog to focus resources on changes with the highest return per unit of effort.
How does Market Basket Analysis improve cross-selling?
Market Basket Analysis identifies which products customers buy together by measuring support and lift across transaction records. Lift scores above 1.5 indicate a genuine association worth targeting in cross-sell campaigns or product bundling.