
TL;DR:
- Advanced dashboards integrate real-time data, AI predictions, and interactive design to enable better business decisions. They differ from traditional reports by providing predictive insights and continuous updates, helping e-commerce teams respond swiftly to market changes. Building these dashboards requires adopting version-controlled configurations, semantic layers, real-time data pipelines, and user-focused design to prevent clutter and foster organizational decision-making.
Advanced dashboarding is defined as the integration of real-time data pipelines, AI-driven predictive analytics, and interactive visualization design to produce business decisions, not just reports. The industry term for this discipline is advanced business intelligence dashboarding, and it marks a clear break from traditional BI tools that only show what happened. For e-commerce analysts and decision-makers, the difference is material. A traditional dashboard tells you that revenue dropped 18% last Tuesday. An advanced dashboard tells you why it dropped, which customer segments drove the decline, and what to do before next Tuesday. This guide covers the core features, practical applications, and implementation practices that define advanced dashboarding in 2026.
What is advanced dashboarding, and how does it differ from traditional BI?
Advanced dashboarding replaces static reports with machine learning driven predictions and prescriptive actions, updating interfaces in real time. That shift from historical summaries to forward-looking guidance is the defining characteristic of the discipline. Traditional BI dashboards answer “what happened.” Advanced dashboards answer “why it happened and what comes next.”

The architecture behind advanced dashboards is fundamentally different from older reporting stacks. Traditional tools pull from a data warehouse on a scheduled refresh, often daily or hourly. Advanced platforms connect to streaming data sources via APIs, so metrics update continuously. For an e-commerce team monitoring flash sale performance, that difference between a 60-minute lag and a 60-second lag can mean thousands of dollars in missed inventory adjustments.
The user experience also changes. Advanced dashboards expose drill-down paths, scenario models, and natural language query interfaces directly in the browser. Analysts no longer need to export data to a spreadsheet to answer a follow-up question. The dashboard itself becomes the analytical workspace.
What key features distinguish advanced dashboards from traditional dashboards?
The features that separate advanced dashboards from basic reporting tools fall into three categories: interactivity, intelligence, and architecture.
Interactivity features:
- Template variables and panel repeats let a single dashboard surface serve every product category or regional market without duplicating the layout. Best advanced dashboards organize data around 3–5 core pillars to provide depth without clutter.
- Dynamic drill-downs allow analysts to move from a store-level revenue view to a SKU-level margin view in two clicks, without leaving the dashboard.
- Cross-filtering links charts so that selecting a customer segment in one panel automatically filters every other panel on the screen.
Intelligence features:
- Natural language querying lets business users ask questions in plain English and receive chart responses instantly. 80–90% of routine ad-hoc queries can be answered through natural language interfaces in 2026 platforms. That number shows how much SQL dependency has already been removed from day-to-day analytics work.
- Automated anomaly detection flags unusual patterns, such as a sudden spike in cart abandonment, without requiring a human to spot it first. AI-powered automation reduces manual monitoring and increases effective signal detection across large datasets.
- Predictive analytics surfaces forecasts alongside actuals, so a demand planner sees projected inventory depletion next to current stock levels.
Architecture features:
- Semantic layers define metrics centrally so that “revenue” means the same thing in every chart, every team, and every report.
- Real-time data pipelines feed the dashboard through API-driven streaming rather than batch exports.
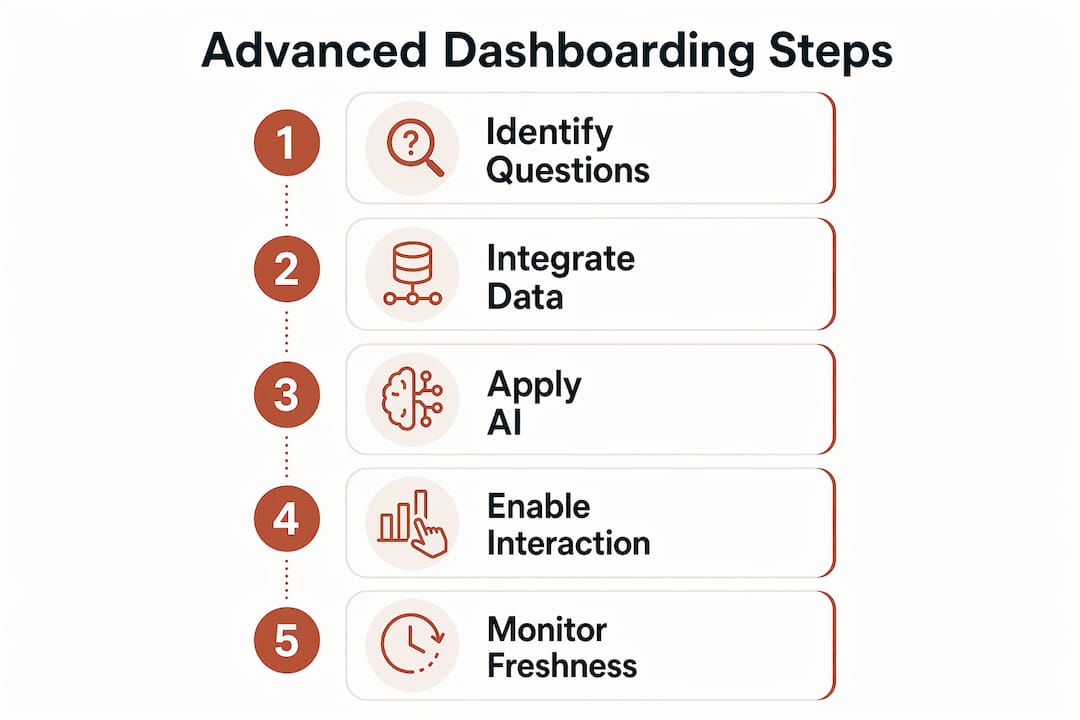
Pro Tip: Build your dashboard around 3–5 core business questions before selecting any visualization type. Analysts who start with the question rather than the chart type produce dashboards that get used daily instead of bookmarked and forgotten.
How do advanced dashboarding techniques improve e-commerce decisions?
Predictive and prescriptive analytics are becoming baseline capabilities for e-commerce teams that need to respond rapidly to market changes. Advanced dashboards put those capabilities directly in front of the people who make decisions, without requiring a data science intermediary.
The practical applications in e-commerce are specific and measurable:
- Inventory forecasting. A dashboard that combines historical sales velocity with current supplier lead times can flag a stockout risk 14 days in advance. That window is enough to place a reorder or adjust promotional spend.
- Dynamic pricing adjustments. Scenario modeling panels let a merchandising manager test the margin impact of a 10% price change on a product bundle before publishing it live. The decision happens in the dashboard, not in a spreadsheet sent back and forth over email.
- Customer segmentation analysis. Persona-aware layouts adapt dashboard complexity to different user roles. An executive sees RFM segment health at a glance. An analyst drills into the cohort-level churn data underneath. Both users work from the same data source, which eliminates version conflicts.
- Fraud detection. Real-time transaction monitoring panels surface order patterns that deviate from baseline behavior, such as a sudden cluster of high-value orders from a new IP range, and trigger automated alerts before chargebacks accumulate.
- Market basket analysis. A data visualization approach that maps product co-purchase frequency directly in a dashboard gives a category manager an immediate view of which bundles to promote this week.
The design principle behind all five applications is the same. Dashboards that don’t inform specific decisions add clutter and reduce clarity. Every panel on an advanced dashboard should connect to a decision someone in the organization actually makes.
Reducing cognitive overload is also a measurable outcome of good dashboard design. When an executive dashboard shows 40 KPIs, none of them get acted on. When it shows 5 KPIs with clear thresholds and trend lines, the executive leaves the meeting with a decision made.
What technical approaches support building advanced dashboards?
Building advanced dashboards that stay reliable over time requires deliberate architectural choices from the start.
Dashboards-as-code is the most important shift in dashboard engineering practice. Managing dashboards via Git and automated testing is an emerging best practice for reliability and scalability. When dashboard configurations live in version control, teams can review changes, roll back errors, and deploy updates through CI/CD pipelines rather than manual edits. For an e-commerce team running dozens of dashboards across marketing, operations, and finance, that discipline prevents configuration drift and undocumented changes.
Semantic-first design is the second pillar. Consistent metrics across all dashboards via semantic layers build organizational trust and support effective decision-making. Without a semantic layer, two dashboards can show different “conversion rate” numbers because one team counts add-to-cart events and another counts completed purchases. That inconsistency destroys confidence in the data faster than any technical failure.
| Design approach | What it solves | When to prioritize |
|---|---|---|
| Dashboards-as-code | Configuration drift, manual errors | Teams managing 10+ dashboards |
| Semantic layer | Metric inconsistency across teams | Organizations with multiple BI consumers |
| Real-time data pipelines | Stale data, delayed decisions | High-velocity e-commerce environments |
| Persona-aware layouts | Cognitive overload, low adoption | Mixed executive and analyst audiences |
Data freshness deserves its own priority. Leading organizations treat data freshness as a primary metric, often using API-driven streaming sources. For an e-commerce business running a 48-hour flash sale, a dashboard refreshing every four hours is operationally useless. The pipeline architecture must match the decision cadence of the team using it.
Pro Tip: Start with a semantic layer before building any dashboard. Define your 10 most critical metrics, their formulas, and their data sources in a shared document. Every dashboard built afterward references that document. This single step eliminates the majority of “why do our numbers disagree?” conversations.
What pitfalls should e-commerce teams avoid when adopting advanced dashboards?
The most common failure mode in advanced dashboarding is not technical. It is organizational. Teams invest in sophisticated platforms and then build dashboards that nobody uses because the design ignored the actual user.
The specific pitfalls to avoid:
- Dashboard clutter. Adding every available metric to a dashboard is the fastest way to make it useless. Each panel competes for attention, and the result is that no signal gets acted on. Limit operational dashboards to the metrics that trigger a specific response.
- Ignoring data freshness. Stale or delayed data in dashboards can lead to dangerous decisions. An inventory dashboard showing yesterday’s stock levels during a high-traffic sale event is worse than no dashboard at all, because it creates false confidence.
- Failing to design for user personas. An analyst dashboard handed to a VP produces confusion, not insight. Persona-aware design is not a luxury feature. It is the difference between a dashboard that gets opened and one that gets ignored.
- Skipping training and change management. Advanced features like natural language querying and scenario modeling require users to understand what questions to ask. Without structured onboarding, teams revert to spreadsheets within weeks of a new platform launch.
- Underestimating automated alerts. Anomaly detection and threshold alerts are the features that make advanced dashboards proactive rather than reactive. Teams that disable alerts to reduce noise miss the entire value proposition of real-time monitoring. Configure alerts with specific thresholds tied to business rules, not generic statistical deviations.
The role of dashboards in e-commerce is to drive action, not to display data. Every design decision should be evaluated against that standard.
Key takeaways
Advanced dashboarding succeeds when real-time data, AI-driven predictions, semantic consistency, and persona-aware design work together to produce decisions, not just visualizations.
| Point | Details |
|---|---|
| Definition matters | Advanced dashboards produce decisions and predictions, not just historical summaries. |
| AI features reduce dependency | Natural language querying removes SQL barriers and speeds up ad-hoc analysis for non-technical users. |
| Semantic layers prevent errors | Centralized metric definitions stop conflicting KPI numbers from undermining organizational trust. |
| Dashboards-as-code improves reliability | Version control and automated testing keep complex dashboard deployments stable and auditable. |
| Design for the user, not the data | Persona-aware layouts and focused KPI sets drive adoption and reduce cognitive overload. |
The maturity gap most e-commerce teams ignore
The organizations I see getting the most value from advanced dashboarding share one trait: they treat it as an organizational capability, not a software purchase. The platform is secondary. The harder work is aligning teams around shared metric definitions, training non-technical users to ask better questions, and building a culture where decisions are expected to be grounded in data before they are made.
The natural language querying capabilities available in 2026 are genuinely impressive. But I have watched teams with access to those features still route every question through a BI analyst because nobody trained the marketing manager to use the query interface. The technology was there. The organizational readiness was not.
My honest view is that most e-commerce teams are two to three maturity levels below where they think they are. They have dashboards. They do not have a decision-making system. The gap between those two things is filled by persona-aware design, semantic layers, and the kind of change management that most analytics projects skip entirely.
The next frontier is conversational dashboards, where an analyst types a question and receives a chart, a forecast, and a recommended action in one response. That capability exists today in early form. The teams that will use it effectively are the ones building the organizational habits now, not the ones waiting for the technology to mature further. Automating retail analytics is already a competitive differentiator. Conversational analytics will be the next one.
— Mateusz
Affinsy’s analytics glossary: go deeper on the concepts that power advanced dashboards
Advanced dashboarding is only as valuable as the analytical techniques feeding it. The three concepts that most directly power e-commerce dashboard insights are market basket analysis, customer segmentation, and product bundling.

Affinsy’s glossary covers each of these in depth. The market basket analysis page explains how co-purchase patterns translate into dashboard-ready product association scores. The customer segmentation entry breaks down RFM modeling and how segment health metrics surface in operational dashboards. The product bundling glossary page connects bundle performance data to the kind of scenario modeling panels described throughout this article. Each page is written for analysts and decision-makers who want the concept explained clearly, not academically.
FAQ
What is advanced dashboarding in simple terms?
Advanced dashboarding is the practice of building data interfaces that combine real-time updates, AI predictions, and interactive design to support business decisions rather than just display historical data.
How does advanced dashboarding differ from standard reporting?
Standard reporting shows what happened in a fixed format. Advanced dashboards update continuously, allow interactive exploration, and surface predictive insights that inform what to do next.
What makes a dashboard “advanced” in 2026?
A dashboard qualifies as advanced when it includes real-time data pipelines, natural language querying, automated anomaly detection, and persona-aware layouts that adapt to different user roles.
What are the biggest benefits of advanced dashboards for e-commerce?
The primary benefits are faster decisions on inventory, pricing, and customer retention, plus reduced reliance on BI teams for routine analysis through natural language query interfaces.
How do you start building an advanced dashboard?
Define your 3–5 core business questions first, establish a semantic layer for your key metrics, connect a real-time data source, and design separate views for executive and analyst personas before adding any advanced features.
Recommended
- Guide to E-Commerce Data Analysis for Increased Sales - Affinsy Blog | Affinsy
- Sales Data Analysis: Unlocking E-Commerce Growth - Affinsy Blog | Affinsy
- Data Visualization in Ecommerce: Driving Sales With Insight - Affinsy Blog | Affinsy
- Master the role of dashboards in ecommerce to boost sales - Affinsy Blog | Affinsy