
TL;DR:
- Modern retail reporting tools provide near-real-time dashboards that enable rapid operational decisions and foster trust through data freshness indicators. They transition from traditional retrospective batch reports to automated, role-based, self-service systems that improve efficiency and consistency across teams. Successful implementation depends on defining KPIs early, aligning refresh rates with business rhythms, and cultivating data literacy within the organization.
Reporting tools in retail are defined as software systems that transform raw transactional and operational data into structured, decision-ready insights across merchandising, finance, and store operations. The role of reporting tools in retail has expanded well beyond monthly spreadsheets. Platforms like Domo, Microsoft Power BI, Looker, and Databricks now deliver near-real-time dashboards that give retail professionals a live view of inventory positions, sales trends, and customer behavior. For business analysts managing multi-channel operations, the difference between a report that refreshes every 24 hours and one that updates within minutes is the difference between reacting to yesterday’s problems and preventing today’s.
How do modern reporting tools differ from traditional retail reporting?
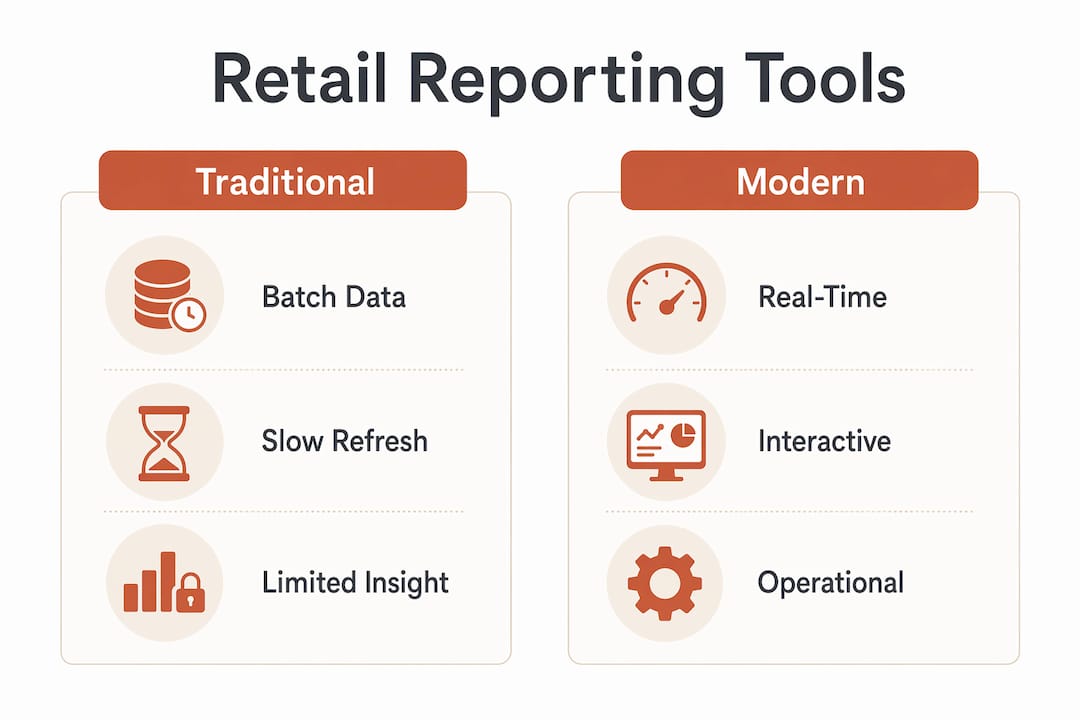
Traditional retail reporting is retrospective by design. Batch-processing cycles run overnight or weekly, meaning the data a store manager sees on Monday morning reflects Friday’s reality. That gap costs money. A promotion that underperforms, a stockout that builds over a weekend, or a staffing imbalance on a busy Saturday all go unaddressed until the next report cycle.
Modern retail business intelligence systems close that gap. Near-real-time dashboards reflect transactions within minutes, not hours, enabling rapid operational responses like inventory reallocation between stores or same-day staffing adjustments. The operational trust this creates is significant. When a floor manager knows the dashboard is current, they act on it. When they suspect the data is stale, they revert to gut instinct.
One underappreciated feature of modern tools is explicit latency communication. Dashboards that display a “data as of 10:47 AM” timestamp tell users exactly how fresh their view is. Data freshness indicators build the operational trust that drives adoption. Without them, even accurate dashboards get ignored.
The table below captures the practical differences retail teams experience when moving from legacy to modern reporting:
| Dimension | Traditional reporting | Modern BI reporting |
|---|---|---|
| Data refresh | Nightly or weekly batch | Near-real-time (minutes) |
| User access | Analyst-generated reports | Self-service dashboards |
| KPI consistency | Varies by spreadsheet owner | Governed semantic layer |
| Operational use | Post-event review | In-day decision support |
| Scalability | Manual effort increases with volume | Automated at scale |
Pro Tip: Before selecting any reporting tool, ask vendors specifically about their data latency. A dashboard that looks modern but refreshes every 12 hours delivers traditional reporting in a modern wrapper.
What key retail performance metrics do reporting tools help monitor?
Retail performance metrics fall into four categories, and each demands a different reporting cadence. Shopify groups 16 core retail metrics into money (gross profit, net profit, revenue per square foot), efficiency (inventory turnover, shrinkage rate, sell-through rate), people (sales per employee, labor cost percentage), and results (conversion rate, average order value, customer lifetime value). This framework matters because it prevents teams from obsessing over revenue while ignoring the efficiency metrics that actually explain margin compression.
The cadence question is just as important as the metric selection. Operational metrics like daily sales, stockout rates, and queue times need daily or even hourly visibility. Strategic metrics like customer lifetime value and category gross margin belong in monthly or quarterly reviews. Misaligning refresh cadence with business rhythms creates a perception problem: technically accurate dashboards feel irrelevant because they update too slowly for the decisions they are meant to support.
Standardized KPI definitions matter more than most retail teams realize. When the marketing team calculates conversion rate from web sessions and the store operations team calculates it from foot traffic, the two numbers are incomparable. Reporting tools that encode consistent metric definitions across systems eliminate the metric disagreements that slow down weekly trading reviews and erode confidence in data. The right interpretation of retail performance depends on comparing like with like, and that requires correct time-windowing built directly into the reporting layer.
- Gross and net profit margins: Reviewed monthly to assess category and channel health
- Inventory turnover and shrinkage: Tracked weekly to flag slow-moving stock and loss events
- Conversion rate and average order value: Monitored daily to evaluate promotional effectiveness
- Sales per employee: Reviewed weekly to optimize scheduling and identify training needs
- Customer lifetime value: Assessed quarterly to guide acquisition spend and loyalty investment
How do reporting tools improve operational efficiency in retail?
The most direct efficiency gain from modern reporting tools is the elimination of manual report production. Automated report generation and distribution via scheduled refresh and email delivery removes the analyst bottleneck that forces business users to wait days for answers to routine questions. A category manager who previously submitted a data request on Monday and received results on Thursday can now open a self-service dashboard and answer the same question in three minutes.

Role-based access controls add a second layer of efficiency. A store manager sees their location’s metrics. A regional director sees aggregated performance across their territory. A finance analyst sees margin and cost data without exposure to HR records. Enterprise reporting software delivers this through pixel-perfect layouts, multi-format exports, and embedded report capabilities that scale across retail organizations without requiring custom development for each user group.
The governance payoff is where the real organizational efficiency lives. Daraz, one of South Asia’s largest e-commerce platforms, cut reporting time by 60% after consolidating 23 separate reporting tools into a single decision intelligence platform with a unified semantic layer. Revenue, customer lifetime value, and return rate metrics were defined once and used consistently across every team. Cross-team friction over whose numbers were correct dropped to near zero. Once KPIs are governed centrally, teams stop requesting custom reports and start doing self-service analysis. That shift alone reclaims dozens of analyst hours per week in a mid-size retail organization.
Separating analytical workloads from transactional systems also matters at scale. Real-time order analytics that run on dedicated infrastructure reduce API response times by over 75%, meaning operational dashboards stay fast even during peak trading periods like Black Friday or end-of-season sales. Slow dashboards get abandoned. Fast ones get used.
What should retail professionals assess when selecting reporting tools?
Choosing a reporting tool is not primarily a technology decision. It is an organizational decision about how your teams will consume data and what level of self-sufficiency you want to build.
- Ease of use for business users. Self-service BI dashboards that support drag-and-drop report building or natural language querying reduce analyst dependency and accelerate adoption. If your store managers cannot use the tool without submitting a ticket, adoption will stall.
- Data connectivity breadth. The tool must connect to your POS system, e-commerce platform, CRM, and inventory management system without requiring custom engineering for each source. Gaps in connectivity create the data silos that undermine the consistency you are trying to build.
- Performance at transaction volume. Test the tool against your actual data volumes, not demo datasets. A dashboard that performs well at 100,000 transactions may degrade significantly at 10 million.
- Governance and KPI management features. Look for a governed semantic layer that lets you define metrics once and reuse them across all reports. This is the single feature that prevents metric drift as your organization scales.
- Cloud versus on-premises deployment. Cloud-based tools offer faster updates and lower infrastructure overhead. On-premises deployments suit retailers with strict data residency requirements or legacy system constraints that make cloud connectivity impractical.
- Refresh cadence alignment. Confirm the tool can deliver the update frequency your operational workflows require. A tool that refreshes hourly is insufficient for a fulfillment center that needs minute-level order visibility.
Pro Tip: Run a proof-of-concept with your actual messy data, not a clean sample. The tools that handle real-world data quality issues gracefully are the ones that will still be in use two years from now.
For a deeper look at the ecommerce KPIs that matter most when evaluating retail reporting outputs, Affinsy’s breakdown of standardized metrics is worth reviewing before you finalize your tool selection criteria.
Key takeaways
Retail reporting tools deliver their greatest value when governed KPI definitions, near-real-time data, and role-based access work together as a system rather than as separate features.
| Point | Details |
|---|---|
| Near-real-time data is operational | Dashboards refreshing within minutes enable in-day decisions that batch reports cannot support. |
| Governed KPIs prevent metric drift | A semantic layer that defines metrics once eliminates cross-team disagreements and builds data trust. |
| Automation reclaims analyst time | Scheduled report distribution removes manual bottlenecks and frees analysts for higher-value work. |
| Cadence must match workflow | Operational metrics need daily or hourly updates; strategic metrics suit monthly or quarterly reviews. |
| Self-service drives adoption | Tools that empower non-technical users to build their own reports reduce dependency and speed decisions. |
Why most retail reporting projects fail before they start
I have seen retail organizations invest heavily in Power BI or Looker, spend months on implementation, and then watch adoption collapse within a quarter. The pattern is almost always the same. The technology works. The governance does not.
The mistake is treating reporting tool selection as a software procurement exercise. The real work is defining your KPIs before you build a single dashboard. If your revenue metric means gross sales in one system and net-of-returns in another, no amount of dashboard polish will fix the confusion that surfaces in your first trading review. I would argue that a governed semantic layer is not a feature to evaluate. It is a prerequisite.
The second consistent failure point is cadence mismatch. A store operations team that needs hourly stockout data will abandon a dashboard that refreshes daily, even if every other metric on it is perfect. Aligning report refresh frequency with the actual decision rhythm of each team is unglamorous work, but it determines whether the tool gets used or ignored.
What I find most undervalued in retail BI implementations is user training that goes beyond “here is how to click the filters.” Teams need to understand what each metric actually measures, what its limitations are, and when to trust it versus when to investigate further. The Daraz case is instructive here. The 60% reduction in reporting time was not just a technology outcome. It was the result of organizational alignment around shared definitions. That kind of outcome requires change management, not just software deployment.
If you are a business analyst advising a retail client, push hard for a data-driven decision culture before the tool goes live. The organizations that get the most from retail reporting tools are the ones that treat data literacy as an operational competency, not an IT project.
— Mateusz
See how Affinsy turns your retail data into decisions

Affinsy is built for retail and e-commerce teams that want to move beyond surface-level dashboards. The platform analyzes your historical transaction data to surface the product associations and customer segments that standard reporting tools miss entirely. Upload your order data via CSV or connect through the API, and Affinsy applies market basket analysis and RFM customer segmentation to show you which products drive cross-sell revenue and which customer groups are at risk of churning. The permanent free tier covers up to 20,000 line items with no credit card required, making it a zero-risk starting point for any retail analyst who wants deeper insight from existing transaction data.
FAQ
What is the role of reporting tools in retail?
Reporting tools in retail convert raw transactional and operational data into structured insights that support decisions across merchandising, inventory, finance, and customer management. Their core function is to make performance visible, consistent, and timely for every team that needs it.
How do reporting tools improve retail decision-making?
Modern retail BI tools deliver near-real-time dashboards that reflect transactions within minutes, enabling managers to respond to stockouts, staffing gaps, and promotional underperformance on the same day they occur rather than after the fact.
What retail KPIs should reporting tools track?
Reporting tools should cover all four metric categories: money metrics like gross profit, efficiency metrics like inventory turnover and shrinkage, people metrics like sales per employee, and results metrics like conversion rate and average order value. Shopify’s 16-metric framework is a practical starting point for structuring a retail KPI dashboard.
Why do retail reporting implementations fail?
The most common cause is inconsistent KPI definitions across source systems, which creates metric disagreements that erode trust in the data. Daraz resolved this by consolidating 23 tools into one platform with a unified semantic layer, cutting reporting time by 60% and eliminating cross-team metric disputes.
What should I look for when choosing a retail reporting tool?
Prioritize governed KPI management, self-service capabilities for non-technical users, and data connectivity to your POS, e-commerce, and inventory systems. Confirm the tool’s refresh cadence matches your operational needs before committing to a full deployment.
Recommended
- E Commerce Analysis Report Guide for 2025 Success - Affinsy Blog | Affinsy
- Ecommerce Reporting Guide: Optimize Store Growth Easily - Affinsy Blog | Affinsy
- 7 Essential Sales Analysis Report Insights for 2025 - Affinsy Blog | Affinsy
- Understanding Retail Analytics Guide 2025 for E-Commerce Success - Affinsy Blog | Affinsy