
TL;DR:
- Advanced reporting uses real-time, multi-dimensional queries and complex aggregates to provide accurate insights. It separates query, presentation, and distribution layers, enabling scalable, multi-format outputs and consistent metrics. This approach improves decision-making through unified data models and eliminates data silos and reconciliation errors.
Advanced reporting is defined as a layer of sophisticated data analysis and presentation that surpasses basic summaries by integrating dynamic, multi-dimensional queries and complex aggregates. Where a standard report tells you what happened, advanced reporting tells you why it happened and what to do next. For data analysts and business leaders, mastering this discipline is the difference between reacting to data and making decisions ahead of the curve.

What is advanced reporting, and how does it differ from basic reporting?
Advanced reporting enables near-real-time data queries covering recent 90-day windows with approximately one-minute data latency. That speed matters because business conditions change faster than a weekly export cycle can capture. Basic reporting, by contrast, delivers static snapshots: row counts, totals, and period-over-period comparisons that answer simple questions but collapse under complex ones.
The structural difference is depth. Basic time intelligence techniques cover roughly 60–70% of standard business reporting needs. The remaining 30–40% of complex scenarios, including financial balance sheets, healthcare analytics, and multi-entity consolidations, require advanced DAX patterns like parent-child hierarchies, many-to-many relationships, and calculation groups. These patterns exist precisely because standard aggregation logic breaks down when data relationships are not simple and flat.
Advanced reporting also separates itself through output flexibility. A basic report produces one format for one audience. An advanced system outputs PDF, Excel, CSV, and JSON from the same underlying query without duplicating logic. That means a finance team, an operations manager, and an external auditor each receive data in the format they need, all from a single governed source.
Here is what distinguishes the two approaches at a glance:
- Real-time vs. static: Advanced systems query live or near-live data. Basic reports run on scheduled batch exports.
- Multi-dimensional vs. flat: Advanced reporting handles many-to-many relationships and hierarchies. Basic reporting assumes flat, normalized tables.
- Multi-format output: Advanced systems generate PDF, Excel, and JSON from one query. Basic tools typically produce one format per report.
- Interactive drilldown: Bind variables in query WHERE clauses let users change displayed data dynamically without custom report development for each drill path.
- Governed metrics: Advanced reporting embeds KPI definitions at the model level. Basic reporting leaves metric definitions to individual spreadsheet authors.
Pro Tip: If your team spends more than 20% of its time reconciling numbers between reports, that is a sign your reporting layer lacks unified metric definitions. Advanced reporting fixes this at the architecture level, not the spreadsheet level.
How are advanced reporting systems architected for scale?
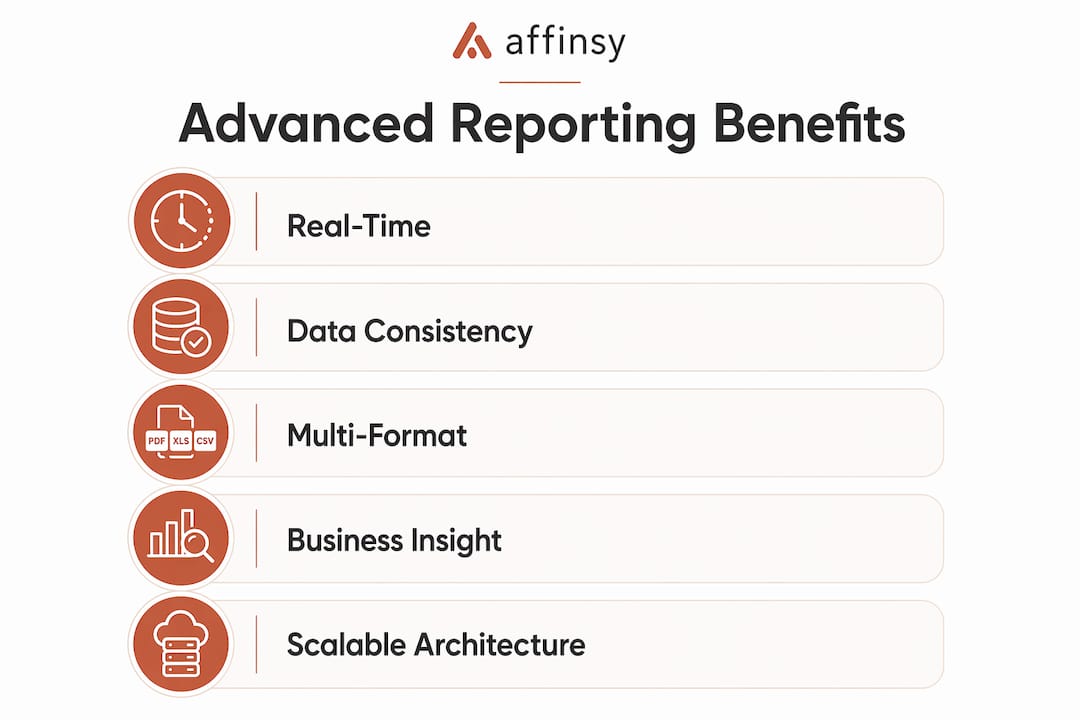
Production-grade advanced reporting systems are built around a strict separation of concerns. Query logic, template engine, format converter, and distribution orchestrator each live in separate layers. Separating query logic from rendering layers enables the system to generate multiple output formats from the same data source without modifying underlying logic. Adding a new output format, say Parquet for a data warehouse team, requires no changes to the query code.
The four core layers work like this:
- Query layer: Retrieves data using parameterized queries. Bind variables handle user-driven filters and drill paths without spawning new report definitions.
- Template engine: Uses tools like Jinja2 with custom filters for metric aggregation. Templates support inheritance, meaning a base financial template can be extended for regional variants without rewriting shared logic.
- Format converter: Transforms the rendered template output into PDF, Excel, CSV, or JSON. The converter is format-agnostic and receives the same structured data regardless of destination.
- Distribution orchestrator: Manages scheduling, retry logic, and delivery channels. Enterprise-grade systems use exponential backoff retry policies with task managers like Celery to handle failures in report generation reliably.
Scheduling in advanced systems goes beyond simple cron jobs. Schedulers handle timezone offsets so a report configured for 8:00 AM in Tokyo fires correctly for a user in Chicago. Report lifecycle states progress from DRAFT through QUEUED, GENERATING, and DISTRIBUTING, giving operations teams full visibility into where a report stands at any moment.
| Layer | Primary function | Key technology examples |
|---|---|---|
| Query layer | Parameterized data retrieval | SQL, OLAP, DAX |
| Template engine | Metric aggregation and layout | Jinja2, custom filters |
| Format converter | Multi-format output | PDF, Excel, CSV, JSON |
| Distribution orchestrator | Scheduling, retries, delivery | Celery, exponential backoff |
Pro Tip: Architect your templates with inheritance from day one. A base template that defines shared layout and metric formatting saves weeks of rework when your organization adds new report variants for new regions or product lines.
What are the main benefits of advanced reporting for business decisions?
The clearest benefit of advanced reporting is data consistency. Static scheduled exports are increasingly replaced by real-time unified models where all reports share a single logical truth, eliminating manual reconciliation. When a CFO and a regional VP pull a revenue figure from the same governed model, they get the same number. That sounds obvious, but it is not the reality in organizations still running fragmented spreadsheet-based BI.
Advanced reporting also eliminates data silos. When query logic, KPI definitions, and output templates live in a shared infrastructure, different teams stop building their own shadow reports. Finance, operations, and marketing all read from the same model. Variance analysis, P&L reconciliation, and cash flow statements update together because they share one source of truth.
The practical advantages for analysts and business leaders include:
- Improved accuracy: Metric definitions are embedded in the model, not in individual spreadsheet formulas that drift over time.
- Faster decisions: Near-real-time data means leaders act on current conditions, not last week’s export.
- Self-service analytics: No-code drag-and-drop interfaces let general users build and filter reports without filing IT requests, while SDKs and APIs give developers full customization control.
- Reduced reconciliation time: Unified models ensure P&L, balance sheets, and cash flow statements reconcile within one governed environment.
- Scalable delivery: A well-architected system delivers reports to thousands of users simultaneously without degrading query performance.
For e-commerce and SaaS businesses specifically, advanced reporting surfaces patterns that basic tools miss entirely. Customer purchasing sequences, product affinity clusters, and cohort retention curves all require multi-dimensional queries that flat exports cannot produce. Understanding data-driven decision making in retail starts with having a reporting layer capable of asking those questions in the first place.
Which advanced reporting techniques should analysts master?
The single most impactful technique for enterprise analytics is calculation groups. Calculation groups prevent “measure explosion” by dynamically applying time intelligence transformations, including year-to-date, quarter-to-date, prior year, and year-over-year percentage, to base measures. Without calculation groups, a model with 10 base measures and 5 time intelligence variants requires 50 separate measures. With calculation groups, it requires 10 base measures and one calculation group. Enterprise models optimized with these patterns reduce report loading times dramatically.
Parent-child hierarchies solve a different problem. Organizational charts, account hierarchies in a chart of accounts, and bill-of-materials structures are all recursive by nature. Standard flat DAX cannot traverse them correctly. Parent-child DAX functions like PATH and PATHCONTAINS flatten these recursive structures into queryable columns, enabling accurate rollups at every level of the hierarchy.
Many-to-many relationships appear constantly in real business data. A customer belongs to multiple segments. A product appears in multiple promotions. A sales rep covers multiple territories. Modeling these relationships incorrectly produces double-counting errors that are notoriously hard to trace. Mastering many-to-many bridge table patterns eliminates this class of error entirely.
For analysts building toward enterprise proficiency, the learning path looks like this. Start with calculation groups and time intelligence, since these appear in nearly every financial model. Then move to parent-child hierarchies for organizational and account structures. Finally, tackle many-to-many relationships and advanced filter context manipulation. Resources like the 2026 enterprise analytics guide cover all three in production-ready depth.
Pro Tip: Before building a new measure, check whether a calculation group can handle the transformation dynamically. If the answer is yes, use the calculation group. Measure sprawl is the leading cause of slow, unmaintainable enterprise models.
For teams that also need to communicate findings externally, understanding agency client reporting practices helps bridge the gap between internal analytics depth and client-facing clarity.
Key Takeaways
Advanced reporting delivers accurate, real-time, multi-format insights by separating query logic, template rendering, and distribution into governed layers that scale across thousands of users and report types.
| Point | Details |
|---|---|
| Definition matters | Advanced reporting goes beyond summaries by using dynamic queries, complex aggregates, and real-time data. |
| Architecture drives scale | Separating query, template, format, and distribution layers enables multi-format output without logic duplication. |
| Calculation groups are critical | They prevent measure explosion and cut report loading times in enterprise DAX models. |
| Unified models eliminate silos | A single source of truth removes reconciliation errors across P&L, cash flow, and balance sheets. |
| Accessibility is expanding | No-code interfaces and developer APIs now serve both general users and technical teams from the same platform. |
Why I think most teams underestimate what advanced reporting actually requires
The conversation about advanced reporting almost always focuses on tools. Teams pick a platform, connect a data source, and expect the sophistication to follow automatically. It does not. The tool is the last 20% of the problem. The first 80% is architecture: how you define metrics, how you separate query logic from presentation, and how you govern the model so that two people asking the same question get the same answer.
I have seen organizations with enterprise-grade platforms still running shadow spreadsheets because the underlying model was never unified. The dashboards looked impressive. The numbers disagreed with each other. That is not an advanced reporting problem. That is a governance problem that no tool solves on its own.
The shift I find most significant right now is not AI-powered visualization. It is the move toward inherited template structures and calculation groups that make models maintainable by a team of two rather than a team of twenty. Scalability in reporting is not about raw compute power. It is about designing models where adding a new region or a new time period requires changing one definition, not rebuilding fifty measures.
The future belongs to teams that treat their reporting layer as a product, not a project. That means versioning, lifecycle management, and documented metric definitions. The role of reporting tools in retail is shifting in exactly this direction, and the organizations that build this discipline now will have a structural advantage over those still reconciling exports manually in 2027.
— Mateusz
How Affinsy fits into your advanced reporting workflow
Advanced reporting produces its highest value when the underlying data is already structured around meaningful business patterns. Affinsy analyzes historical transaction data to surface product associations and customer segmentation patterns that standard reporting layers never see. Its market basket analysis identifies which products customers buy together, giving your reports a behavioral dimension that goes beyond revenue totals. The customer segmentation engine applies RFM scoring to your order history, so your dashboards can report on high-value, at-risk, and lapsed customer groups with precision. Affinsy connects via API, CSV upload, or MCP, with a permanent free tier covering up to 20,000 line items and no credit card required.
FAQ
What is advanced reporting in simple terms?
Advanced reporting is the practice of using dynamic, multi-dimensional queries and complex aggregates to produce reports that go beyond basic totals and summaries. It enables near-real-time data access, interactive drilldown, and multi-format output from a single governed data model.
What are the most important advanced reporting techniques?
Calculation groups, parent-child hierarchies, and many-to-many relationship patterns are the three techniques that cover the majority of complex enterprise scenarios. Calculation groups alone prevent measure explosion in financial models by applying time intelligence transformations dynamically.
How do advanced reporting tools handle multiple output formats?
Production-grade systems separate query logic from the rendering layer, so the same data source generates PDF, Excel, CSV, and JSON without duplicating underlying logic. Adding a new format requires changes only to the format converter layer, not to the query or template code.
What is data visualization in the context of advanced reporting?
Data visualization is the graphical presentation layer of advanced reporting, turning query results into charts, heatmaps, and interactive dashboards. Mature platforms offer both no-code drag-and-drop visualization for general users and API-level customization for developers.
How does advanced reporting improve business decision-making?
Advanced reporting replaces fragmented static exports with unified real-time models where KPIs are defined once and inherited across all dashboards. This eliminates reconciliation errors and gives leaders consistent, current data to act on rather than competing versions of the same metric.