
TL;DR:
- AOV measures the average dollar amount spent per transaction, providing insight into revenue efficiency. Improving AOV through margin-safe tactics like bundling and free-shipping thresholds can significantly boost profits without increasing customer acquisition costs. Tracking segmented, contribution-margin-aware metrics and using AI-driven analysis helps identify high-potential opportunities for sustainable growth.
Average order value (AOV) is the average dollar amount a customer spends per transaction. The formula is simple: AOV = Total product revenue ÷ Number of orders. If your store generated $45,000 from 750 orders last month, your AOV is $60. That single number tells you more about your revenue efficiency than traffic volume ever will.
Three things you can do right now:
- Calculate your rolling 30-day AOV using product revenue only (exclude taxes, shipping fees, and refunds for a clean baseline).
- Segment that number by new vs. returning customers. The gap between those two figures is usually where the biggest opportunity hides.
- Pick one measurable test: a free-shipping progress bar set 10–15% above your current AOV, or a single product bundle. Run it for a few weeks before drawing conclusions.
AOV matters because every dollar of improvement compounds across every order you process, without spending a cent more on acquisition.
Table of Contents
- What does AOV actually measure, and what gets left out?
- How to calculate AOV correctly
- Is your AOV healthy for your category?
- Why AOV is one of the highest-leverage growth levers you have
- What actually works to increase average order value
- How to measure whether your AOV initiatives are working
- How AI and market-basket analysis scale AOV optimization
- Common AOV mistakes that quietly hurt your margins
- Key Takeaways
- The discipline most AOV guides skip
- Find your highest-confidence AOV wins with Affinsy
- Useful sources
What does AOV actually measure, and what gets left out?
AOV measures revenue per completed order, not revenue per session, per visitor, or per customer. That distinction matters. A customer who places three orders in a month contributes three data points to your AOV, not one. If you want lifetime value, that is a different metric entirely.
What to include and exclude:
- Include: product revenue (the price paid for items, after any applied discount codes)
- Exclude: shipping charges, taxes, gift card purchases (they are not product revenue), and refunded orders or refunded line items
Excluding refunds is especially important for U.S. stores with high return rates in categories like apparel. A $120 order that gets fully returned inflates your AOV if you count it, then silently disappears from revenue.
Two terms that often get confused with AOV: average basket value and customer lifetime value (CLTV). Average basket value sometimes includes shipping and taxes, depending on the platform. CLTV aggregates all orders a customer ever places. AOV is a snapshot of a single transaction. Segmenting AOV by customer type, channel, and device reveals different opportunities that a blended number hides entirely.

For reporting cadence, use daily AOV for operational decisions (spotting a sudden drop after a site change), and weekly or monthly AOV for strategy. A single bad day skews daily reads; monthly smooths too much for fast-moving tests.
How to calculate AOV correctly
The canonical formula: AOV = Total product revenue ÷ Number of orders

A one-line example: $120,000 in product revenue across 2,000 orders = $60 AOV.
What counts as product revenue?
| Revenue component | Include in AOV? | Why |
|---|---|---|
| Product sale price (post-discount) | Yes | Core transaction value |
| Shipping charges | No | Not product revenue |
| Sales tax | No | Pass-through, not margin |
| Gift card purchases | No | Not a product transaction |
| Refunded orders | No | Revenue was reversed |
| Partial refunds | Adjust | Subtract refunded amount from order value |
Two worked examples
Example 1: Small DTC apparel store Monthly product revenue: $28,500. Orders placed: 475. AOV = $28,500 ÷ 475 = $60.00.
Example 2: Mid-range electronics store Monthly product revenue: $312,000. Orders placed: 1,040. AOV = $312,000 ÷ 1,040 = $300.00.
For tracking, a rolling 30-day AOV gives you a live read that smooths weekend volatility. A monthly snapshot is cleaner for period-over-period comparisons and board reporting. Use rolling 30-day when you are actively running tests; switch to monthly snapshots for quarterly reviews.
Is your AOV healthy for your category?
There is no universal “good” AOV. A $45 AOV is strong for a beauty consumables brand and weak for a home furniture store. What matters is how your number compares to peers in your category and whether it supports your unit economics.
Directional U.S. category ranges (general guidance, not official benchmarks):
- Apparel and footwear: $75–$150
- Beauty and personal care: $40–$80
- Consumer electronics: $200–$500+
- Home goods and furniture: $150–$400
- Food and beverage (DTC): $35–$75
These ranges shift with price positioning, subscription vs. one-time purchase mix, and whether you sell B2C or B2B. Comparing your AOV to a global average is close to meaningless. The meaningful comparison is against your own historical trend and against your customer acquisition cost (CAC). If your AOV is $55 and your blended CAC is $40, you have almost no room for margin after fulfillment costs.
Pro Tip: Instead of targeting AOV in isolation, track revenue per visitor (RPV = AOV × conversion rate). A tactic that raises AOV 15% but drops conversion 10% may actually reduce RPV. RPV is the number that tells you whether a test actually helped.
Why AOV is one of the highest-leverage growth levers you have
Raising AOV is cheaper than buying more traffic. Here is the math: a store doing $1M annually at a $60 AOV that lifts AOV to $72 generates roughly $200,000 more annually without a single additional customer. That same $200K through paid acquisition at a $40 CAC would require 5,000 new customers.
The compounding effect is the point. Every order benefits. You do not need to win new customers to see the lift; you just need existing buyers to spend a little more per transaction.
Direct effects of a higher AOV:
- CAC payback shortens. If a customer’s first order covers more of your acquisition cost, you reach profitability faster.
- Fulfillment efficiency improves. Shipping one $90 order costs less per dollar of revenue than shipping two $45 orders.
- Inventory planning gets easier. Higher-AOV orders often include bundles or multi-unit purchases, which helps you forecast demand for specific SKU combinations.
For a deeper look at why AOV optimization compounds so effectively, the math on CAC payback alone makes it one of the first levers worth pulling before increasing ad spend.
What actually works to increase average order value
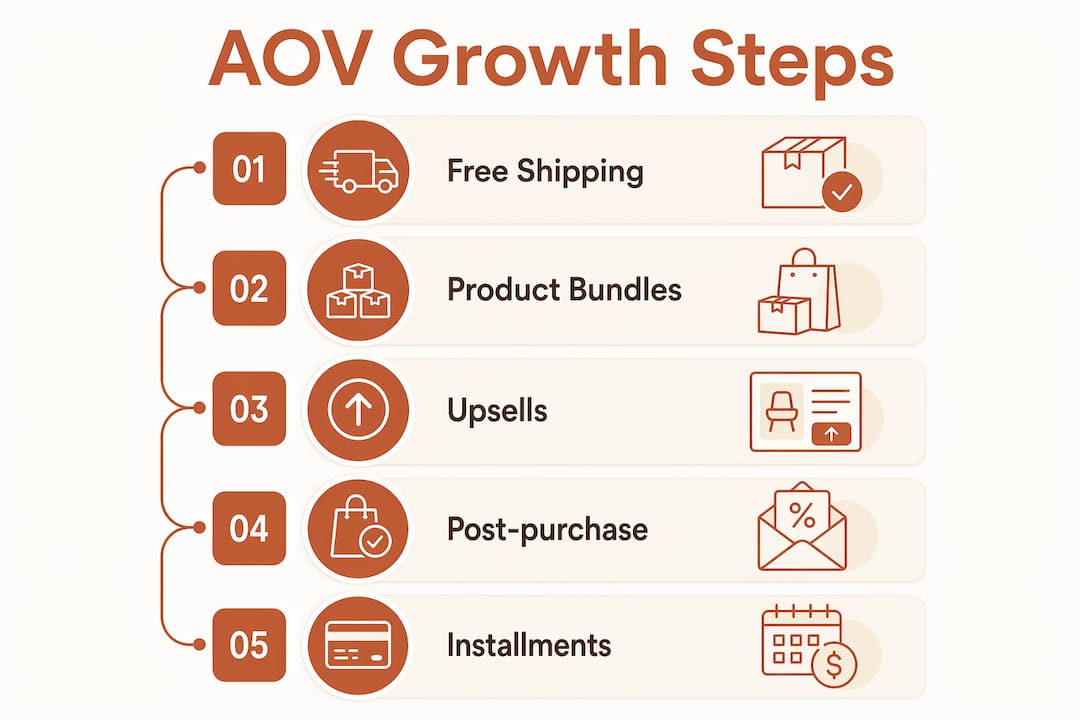
The tactics below are ranked roughly by implementation speed and margin safety. Start with the top two or three before layering in more.
1. Free-shipping progress bar
90% of U.S. shoppers report adding items to qualify for free shipping, and 58% do so when the threshold is clearly communicated. Set your threshold slightly above your current AOV. A store at average AOV should target a threshold just above that value.
This is the fastest, lowest-cost lever available, often showing measurable results within two weeks.
A/B test design: Show the progress bar to 50% of visitors, hide it from the control group. Primary metric: RPV. Watch conversion rate closely — if it drops more than the AOV gain, the threshold may be too high.
2. Product bundles
Bundles typically lift AOV by 20–35%; best-in-class bundle implementations can reach around 55% uplift. The key is pairing products that genuinely belong together, not forcing combinations. A skincare brand bundling a cleanser, toner, and moisturizer at a 10% discount is a natural bundle. Randomly grouping slow-moving SKUs is not.
For implementation guidance on building bundles that actually convert, data-driven bundling approaches using transaction history consistently outperform manual merchandising guesses.
Margin risk: Bundles with deep discounts can erode margin even as AOV rises. Keep bundle discounts at 10–15% unless your product margins support more.
3. Pre-purchase upsells and cross-sells
Offer a relevant upgrade or add-on at the product page or cart stage, before checkout. Keep the upsell price under 25% of the cart total to avoid sticker shock. For specific upselling ideas that work at the product page and checkout level, implementation details matter as much as the offer itself.
4. Post-purchase offers
A one-click offer shown on the confirmation page, after payment is captured, carries zero conversion risk to the original order. Even a 5–8% uptake rate on a $20 add-on moves AOV meaningfully at scale.
5. BNPL and installment options
Buy-now-pay-later options can increase AOV by 20–40% on appropriate categories by removing the psychological barrier of a large upfront payment. Most effective for electronics, furniture, and fitness equipment above $150.
6. Volume and quantity discounts
“Buy 2, save 10%” works well for consumables and replenishment categories. It raises AOV and reduces future acquisition cost by pulling forward demand.
Pro Tip: Stack two or three complementary tactics rather than all of them at once. A free-shipping bar plus one bundle plus a post-purchase offer is a clean test stack. Adding five tactics simultaneously makes it impossible to know what drove the lift.
How to measure whether your AOV initiatives are working
Tracking AOV alone is not enough. These companion metrics tell you whether the improvement is real and sustainable:
- Revenue per visitor (RPV): AOV × conversion rate. The single most important validation metric.
- Conversion rate: Watch for drops when you raise thresholds or add upsell friction.
- Refund and return rate: A rising AOV alongside rising returns often means customers are over-buying to hit a threshold and then returning items.
- Contribution margin per order: Revenue minus COGS, shipping, and payment processing. AOV growth that compresses this number is not growth.
Segmentation you should set up before testing
| Segment | Why it matters |
|---|---|
| New vs. returning customers | Returning customers typically have higher AOV; blending hides this |
| Acquisition channel | Paid social, email, and organic often show very different AOV profiles |
| Device type | Mobile AOV often lags desktop; checkout friction differs |
| Product category | Electronics and apparel AOV are not comparable |
| 30/90-day cohorts | Cohort windows show whether AOV improvements persist |
Before launching any test, capture a clean baseline for at least 30 days, segmented by source, device, and customer type. Without a clean control, you cannot separate a tactic’s effect from seasonal noise or a concurrent promotion.
To avoid false positives: run tests for a minimum of two full weeks (four is better), avoid launching during major promotional periods, and use winsorized or median AOV as a robustness check when a few very large orders are skewing your mean.
How AI and market-basket analysis scale AOV optimization
Manual merchandising can surface obvious product pairings. What it misses is the non-obvious ones: the $12 accessory that, when shown alongside a specific SKU, converts at 3× the rate of any other add-on. Market-basket analysis finds those associations automatically by scanning thousands of transaction combinations that no human analyst would check manually.
The difference between generic cross-sells and AI-personalized recommendations is measurable. AI-driven recommendations deliver 15–30% AOV increases on average, with single recommendation engagements sometimes producing even higher lifts.
Execution checklist for using AI-driven basket analysis:
- Export at least 90 days of transaction data (more is better for confidence).
- Identify the top 10–20 product pairs by association strength and purchase frequency.
- Validate each pairing with a small sample cohort before rolling out site-wide.
- Build frictionless one-click bundle or add-on offers around the top pairings.
- Monitor return rates on AI-suggested bundles for the first 60 days.
Pro Tip: Prioritize high-lift, low-friction opportunities first. A $9 add-on that pushes a $58 cart to $67 (clearing a $66 free-shipping threshold) is more powerful than a $40 upsell that requires a separate decision. Low-cost complementary items that clear thresholds are the fastest path to AOV gains with minimal return risk.
Common AOV mistakes that quietly hurt your margins
Raising AOV the wrong way is worse than not raising it at all. These are the mistakes worth avoiding:
- Discount-driven AOV inflation. A 20%-off sitewide sale will raise AOV if customers buy more, but it compresses margin on every order. Measure contribution margin per order, not just AOV.
- Ignoring returns and refunds. If your return rate climbs alongside AOV, you may be pushing customers to over-buy. Segment your refund rate by the same cohorts you use for AOV.
- Threshold set too high. A free-shipping bar at $120 on a $55 AOV store asks customers to more than double their spend. Most will not. Set it 10–30% above current AOV, not 100%.
- Overlapping promotions. Running a bundle discount, a loyalty points event, and a free-shipping threshold simultaneously makes it impossible to attribute results. Isolate tests.
- Skipping operational prep. Higher AOV often means larger, heavier, or more complex orders. If your fulfillment team is not ready for increased multi-item packing, you will see delays and damage claims that erode the customer experience.
The corrective action for most of these is the same: measure contribution margin per order, segment your results, and use a control group whenever possible.
Key Takeaways
AOV grows sustainably when you pair margin-safe tactics with rigorous RPV tracking, not when you chase the number through discounts alone.
| Point | Details |
|---|---|
| Calculate a clean baseline | Use product revenue only, exclude taxes, shipping, and refunds, over a rolling 30-day window. |
| Segment before you test | Split AOV by new vs. returning, channel, and device to find the highest-opportunity pockets. |
| Start with the free-shipping bar | Set the threshold 10–15% above current AOV; it is the fastest lever with measurable results in two weeks. |
| Track RPV, not just AOV | Revenue per visitor (AOV × conversion rate) tells you whether a tactic actually helped or just shifted behavior. |
| Affinsy surfaces bundle hypotheses | Upload your transaction data to Affinsy’s market-basket analysis to rank high-confidence product pairings before you build a single bundle. |
The discipline most AOV guides skip
Most AOV content focuses on the tactics. The harder part is the discipline around measurement and margin protection. A free-shipping bar is easy to implement. Knowing whether it actually improved your business, three months later, after a seasonal shift and two other tests, is the real challenge.
The teams that win at AOV optimization tend to share one habit: they fix the measurement infrastructure before they run the first test. RPV tracking, segmented baselines, and contribution margin reporting are not advanced analytics. They are the minimum viable setup for knowing whether your work is paying off.
Where AI-driven analysis changes the equation is in prioritization. Instead of guessing which bundles to test, you can rank hypotheses by historical association strength and expected lift. That means fewer wasted experiments and faster iteration cycles. The stores that compound AOV gains year over year are not running more tests. They are running better-targeted ones.
Find your highest-confidence AOV wins with Affinsy
Most stores have dozens of high-probability bundle and cross-sell opportunities sitting in their transaction history, invisible until someone runs the analysis. Affinsy’s market-basket analysis surfaces those product associations automatically, ranks them by confidence and lift potential, and exports ready-to-use customer segments directly to Klaviyo, MailerLite, or Omnisend.
The free tier covers up to 20,000 line items with full platform access and no credit card required. Upload a CSV of your order history, run a basket analysis, and you will have a ranked list of bundle hypotheses within minutes. For larger datasets or API access, Pro starts at $49/month and Max at $199/month. You can also explore RFM customer segmentation to identify which customer groups respond best to AOV-lifting offers before you spend a dollar on testing.
To get started: sign up for the free tier, export your order data from Shopify, WooCommerce, BigCommerce, or any platform that produces transaction records, upload via CSV or connect via API, and run your first basket analysis.
Useful sources
- CommerceV3: Increasing AOV — E-Commerce Guide — Benchmarks for bundle lifts, free-shipping behavior, and AI recommendation impact; one of the most data-rich AOV references available.
- Klipfolio: What Is Average Order Value (AOV)? — Clean definition, segmentation guidance, and KPI context for ecommerce reporting.
- CartyLabs: Shopify AOV Playbook — Practical Shopify-specific implementation guide with threshold math and test timelines.
- MercadoKit: How to Increase AOV — 7 Strategies — Directional lift ranges for BNPL, bundles, and upsells with implementation notes.
- TrueMargin: How to Increase Average Order Value — Emphasis on baseline capture, control groups, and avoiding misattribution in AOV tests.
- Affinsy: Market Basket Analysis Glossary — Explains how transaction-level association analysis surfaces bundle and cross-sell hypotheses.
- Affinsy: How to Maximize Average Order Value — Practical approaches and margin-safe implementation examples for ecommerce teams.
- Affinsy: Data-Driven Bundling Guide — Technical and merchandising guidance for building bundles backed by transaction data.
- Stackr: Deal Forum and Cashback Behavior — External perspective on deal-seeking buyer psychology relevant to discount-driven AOV strategies.