
TL;DR:
- Predictive sales reporting uses historical data, AI, and pipeline weighting to project future revenue accurately.
- High forecast accuracy depends on clean data, consistent pipeline stages, and daily tracking of leading indicators.
Predictive sales reporting is defined as the practice of using historical transaction data, pipeline weighted probabilities, and AI analytics to generate forward-looking revenue forecasts. For e-commerce business analysts and sales directors, these reports replace gut-feel projections with quantified, repeatable forecasts. Best-in-class revenue teams achieve forecast variance within ±5% by triangulating bottom-up rep commitments, top-down trends, and AI-driven pipeline weighting. That standard is achievable when you build the right data foundation and apply the right methods. This guide walks you through creating predictive sales reports that meet that benchmark.
What data do you need for creating predictive sales reports?
The quality of a predictive sales report is determined entirely by the quality of its inputs. Garbage in, garbage out is not a cliché here. It is the single most common reason forecasts fail.
The core data sources you need are:
- Historical sales data: Closed-won and closed-lost records with deal size, close date, sales cycle length, and rep attribution.
- CRM pipeline data: Active opportunities with stage, probability, expected close date, and last activity date.
- Rep performance metrics: Win rates, average deal size, and sales cycle duration by individual rep and team.
- Leading indicators: Discovery calls booked, demos completed, and proposals sent. Leading indicators predict pipeline 30–60 days ahead of lagging CRM data, making them critical for early warning.
- External signals: Seasonality patterns, market trends, and promotional calendars specific to your e-commerce category.
Pipeline hygiene is not optional. Inconsistent CRM stage definitions and missing activity logs are the top causes of forecasting failures. Every stage must have a written exit criterion. A deal does not move from “Proposal Sent” to “Negotiation” because a rep says so. It moves when a documented criterion is met, such as a verbal agreement on scope.
Data centralization matters as much as data quality. Export your order and transaction data from Shopify, WooCommerce, BigCommerce, or Stripe into a single reporting environment. Feed that data into your analytics platform via API or CSV upload so your reports always reflect the current state of the pipeline.

Pro Tip: Automate your data refresh on a daily schedule. Stale pipeline data is the silent killer of forecast accuracy. A report built on data that is three days old will systematically undercount deals that slipped and overcount deals that closed.
How do you build a predictive sales report step by step?
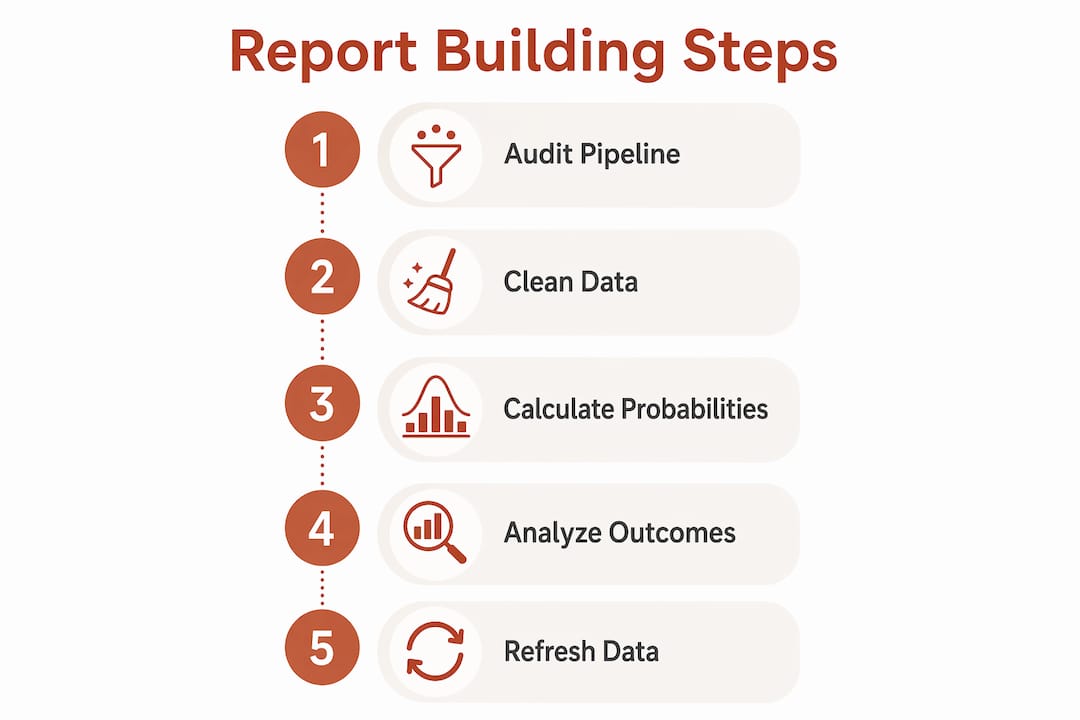
A repeatable workflow separates teams that forecast accurately from teams that guess with spreadsheets. Follow these six steps in sequence.
-
Audit and clean pipeline stages. Review every open opportunity. Remove duplicates, close out stale deals, and enforce stage exit criteria across the entire team. This step is not glamorous, but skipping it corrupts every calculation that follows.
-
Calculate weighted pipeline values. The stage-weighted pipeline model multiplies each deal’s value by its stage probability. A $50,000 deal at a 40% close probability contributes $20,000 to the weighted forecast. This model is the standard in B2B and e-commerce sales forecasting.
-
Identify and track leading indicators daily. Log discovery calls, demos, and proposals as they happen. Tracking leading indicators daily improves forecast accuracy beyond what static CRM data alone can provide. These signals tell you what your pipeline will look like in 30–60 days, not just today.
-
Conduct weekly variance analysis. Compare your forecast from the prior week against actual outcomes. Document the gap and identify its cause. Did a deal slip? Did a rep overstate probability? Variance analysis is how you calibrate your model over time.
-
Build a 13-week rolling forecast dashboard. A rolling 13-week view updated weekly delivers 85%+ revenue prediction accuracy by the 30-day mark. This format replaces static monthly snapshots with a living document that highlights risk concentrations before they become missed targets.
-
Automate data refresh and set alerts. Configure your reporting tool to pull fresh CRM and transaction data daily. Set threshold alerts for pipeline coverage drops, deal slippage, and probability changes above a defined percentage.
| Step | Action | Purpose |
|---|---|---|
| 1. Audit pipeline | Clean stages and remove stale deals | Eliminate data corruption at the source |
| 2. Weight pipeline | Multiply deal value by stage probability | Produce a quantified forecast baseline |
| 3. Track leading indicators | Log calls, demos, proposals daily | Predict pipeline 30–60 days ahead |
| 4. Variance analysis | Compare forecast to actuals weekly | Calibrate probabilities over time |
| 5. Rolling dashboard | Build a 13-week view updated weekly | Maintain a living, risk-aware forecast |
| 6. Automate refresh | Schedule daily data pulls and alerts | Sustain accuracy without manual effort |
Pro Tip: Run your variance analysis on Mondays before your team pipeline review. You will catch slipped deals before they disappear from the conversation entirely.
How does AI improve predictive sales analytics?
AI does not replace the six-step process above. It sits on top of it and improves the accuracy of step two and step four. Understanding that distinction prevents the most common mistake teams make when adopting AI forecasting.
AI forecasting models that ingest CRM data, rep activity, and external signals reduce forecast variance by 30–50% when fed quality data. That qualifier matters. An AI model trained on dirty pipeline data will produce confident-sounding wrong answers. Clean data first, then apply AI.
The most practical AI applications for e-commerce sales forecasting include:
- Gradient boosting models: Trained on historical win/loss data, deal attributes, and rep activity patterns to predict close probability more accurately than static stage percentages.
- Natural language processing (NLP): Quantifying qualitative deal signals such as competitor mentions in call notes improves model accuracy by adding context that CRM fields miss.
- External data integration: Feeding in seasonality indexes, ad spend data, and category-level market trends gives the model signals that your internal pipeline cannot see.
- Blended forecast outputs: Combining AI probability scores with bottom-up rep commits and top-down trend analysis produces the most accurate final number.
For AI in e-commerce forecasting, the practical recommendation is to use AI as a tiebreaker, not a replacement for human judgment. When a rep commits to closing a deal and the AI model assigns it a 20% probability, that gap demands a conversation. It does not demand that you override the rep automatically.
Predictive reports are evolving from static lagging metrics to dynamic systems that highlight risk concentrations, enabling proactive management before targets are missed.
Build a feedback loop into your AI workflow. Every week, feed actual outcomes back into the model as new training data. Teams that do this see model accuracy improve measurably over a 90-day period. Teams that treat AI as a set-and-forget tool watch it drift out of calibration as market conditions change.
Pro Tip: Start with a simple gradient boosting model trained on 12 months of historical data before adding external signals. Complexity added before the baseline is solid creates noise, not accuracy.
What are the most common pitfalls in predictive sales reporting?
Even well-designed forecasting systems degrade over time. The causes are predictable, and so are the fixes.
- Inconsistent stage definitions: When reps define “Proposal Sent” differently, the weighted pipeline calculation breaks. Standardize stage exit criteria in writing and audit compliance monthly.
- Low pipeline coverage ratios: A pipeline coverage ratio below 3x quota significantly increases the risk of missing sales targets. If your pipeline is thin, no forecasting model can compensate. Coverage discipline is the biggest predictor of forecast accuracy, not model sophistication.
- Overreliance on lagging metrics: Closed revenue from last month tells you what happened. Discovery calls booked this week tell you what will happen. Teams that report only on lagging metrics are always reacting, never anticipating.
- Deal slippage without reclassification: When a deal misses its expected close date, its probability must be recalculated. Leaving it in the forecast at the original probability inflates your number and masks real risk.
- Ignoring variance analysis: Skipping the weekly comparison between forecast and actuals means you never learn from your errors. Probabilities stay miscalibrated, and the same mistakes repeat every quarter.
Pipeline coverage discipline, not model complexity, is the biggest predictor of forecast accuracy. AI serves best as a validator in this context. The most accurate forecasts come from teams that maintain clean pipelines, track leading indicators, and use AI to surface anomalies rather than generate the entire forecast.
Pro Tip: Flag any deal that has not had a logged activity in 14 days as “at risk” automatically. Deals without recent activity rarely close on schedule, and catching them early preserves forecast integrity.
Key Takeaways
Accurate predictive sales reporting requires clean pipeline data, weighted probability models, leading indicator tracking, and AI used as a validator rather than a replacement for human judgment.
| Point | Details |
|---|---|
| Data quality is foundational | Inconsistent stage definitions corrupt every forecast calculation before it begins. |
| Weight your pipeline by stage | Multiply deal value by stage probability to produce a quantified, comparable forecast baseline. |
| Track leading indicators daily | Discovery calls and proposals predict pipeline 30–60 days ahead of lagging CRM data. |
| Use a 13-week rolling dashboard | Weekly updates deliver 85%+ accuracy at the 30-day mark and surface risk early. |
| AI validates, not replaces | AI reduces variance by 30–50% on clean data but requires human judgment to interpret gaps. |
Why I think most teams are forecasting backwards
Sales directors and analysts spend enormous energy on the back end of the forecast: variance analysis, board reporting, and explaining why last quarter missed. The teams I have seen forecast most accurately spend that same energy on the front end, specifically on pipeline coverage and leading indicators.
The 13-week rolling dashboard changed how I think about predictive analytics in retail. A static monthly forecast is a photograph. A rolling weekly forecast is a video. You see the deal slipping before it slips. You see the coverage gap before it becomes a missed quarter.
AI is genuinely useful here, but not in the way most vendors pitch it. The value is not in the AI generating a number you trust blindly. The value is in the AI flagging the deals where the rep’s gut and the model’s probability diverge sharply. Those gaps are where the real coaching conversations happen.
The teams that build a data culture around forecasting, where reps understand why stage hygiene matters and managers review variance every week, outperform teams with better technology and worse discipline. The tool is not the answer. The process is.
Rolling forecasts also change how sales leaders think about risk. When you can see 13 weeks of weighted pipeline at once, you stop managing to the end of the quarter and start managing to the next 90 days. That shift in perspective is worth more than any model upgrade.
— Mateusz
Affinsy and the analytics behind better sales forecasts
Predictive sales reporting does not stop at pipeline data. The most complete picture of future revenue includes customer behavior patterns, product affinity signals, and segment-level retention trends.
Affinsy analyzes your historical transaction data to surface market basket analysis insights and RFM customer segmentation patterns that feed directly into your forecasting models. You export order data from Shopify, WooCommerce, BigCommerce, or Stripe and connect via API or CSV upload. No data science skills are required. The permanent free tier covers up to 20,000 line items with full product access and no credit card required. For teams building reporting tools in retail that go beyond pipeline weighting, Affinsy adds the customer and product layer that CRM data alone cannot provide.
FAQ
What is a predictive sales report?
A predictive sales report uses historical data, pipeline weighted probabilities, and AI analytics to forecast future revenue. It replaces static snapshots with dynamic, regularly updated projections.
How accurate can a predictive sales forecast be?
Best-in-class teams achieve forecast variance within ±5% by blending bottom-up rep commits, top-down trends, and AI-driven pipeline weighting. A 13-week rolling dashboard updated weekly delivers 85%+ accuracy at the 30-day mark.
What is the stage-weighted pipeline model?
The stage-weighted pipeline model multiplies each deal’s value by its assigned close probability at each CRM stage. It is the standard forecasting method in B2B and e-commerce sales.
How does AI improve sales forecasting accuracy?
AI models that ingest CRM data, rep activity, and external signals reduce forecast variance by 30–50% on clean data. AI works best as a validator alongside human judgment, not as a standalone forecast generator.
What causes predictive sales reports to fail?
Inconsistent CRM stage definitions and missing activity data are the most common causes of forecast failure. Fixing data hygiene before deploying any forecasting model is the single highest-impact step a team can take.
Recommended
- How to create actionable sales reports for e-commerce - Affinsy Blog | Affinsy
- Sales Data Analysis: Unlocking E-Commerce Growth - Affinsy Blog | Affinsy
- E Commerce Analysis Report Guide for 2025 Success - Affinsy Blog | Affinsy
- Ecommerce Reporting Guide: Optimize Store Growth Easily - Affinsy Blog | Affinsy