
TL;DR:
- Data-driven marketing yields significantly higher revenue than gut-feel decisions.
- Building trustworthy, integrated data foundations is crucial for effective segmenting and analysis.
- Operationalizing insights through clear ownership and automation is key to scaling results.
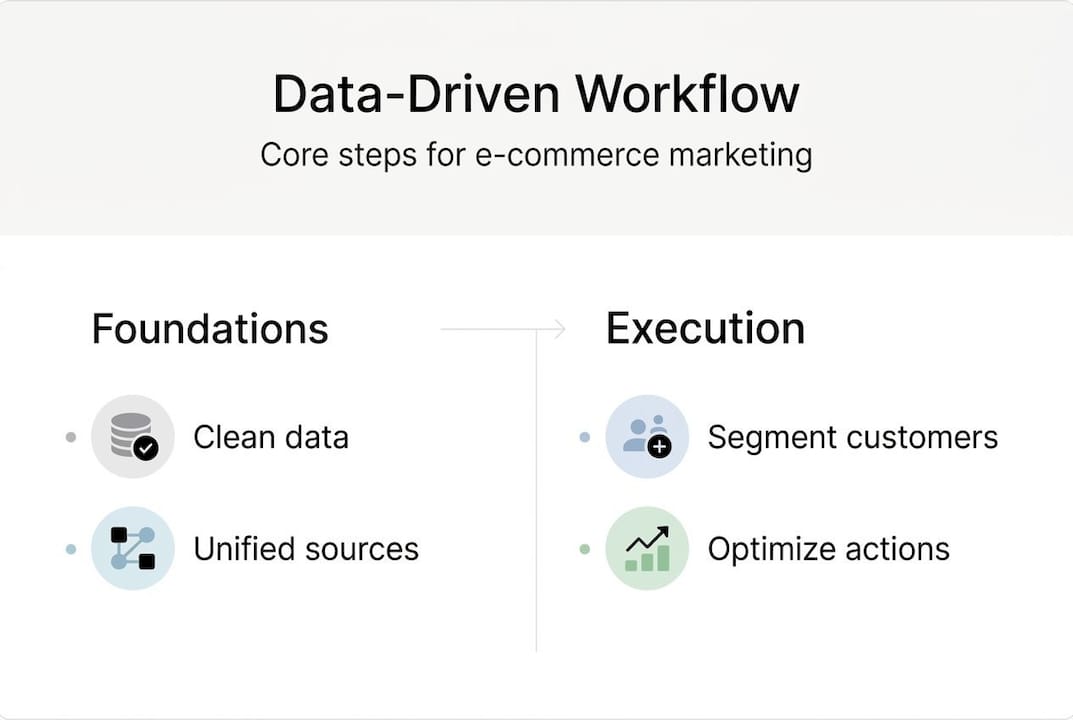
Marketing decisions made on gut feel have a real cost. When you guess which segment to target or which product to bundle, you leave measurable revenue on the table. Structured analytics reviews yield 3.7x more revenue per marketing dollar, and RFM-segmented email campaigns generate 3 to 5 times the revenue per send compared to batch-and-blast approaches. The workflow laid out below walks you through every stage, from getting your data in order to acting on segment insights, so you can build repeatable, measurable growth instead of hoping the next campaign lands.
Table of Contents
- Laying the groundwork: Data foundations for marketing decisions
- Workflow step 1: Hypotheses, KPIs, and tracking setup
- Workflow step 2: Customer segmentation using RFM and beyond
- Workflow step 3: Analyzing results, attribution, and continuous improvement
- What most miss about scaling data-driven marketing
- Take the next step: Free tools and advanced segmentation resources
- Frequently asked questions
Key Takeaways
| Point | Details |
|---|---|
| Solid data foundation | Reliable, unified data is essential for every data-driven marketing decision. |
| KPI-aligned hypotheses | Link each marketing test to clear KPIs directly tied to business goals. |
| RFM segmentation power | RFM segments drive targeted campaigns, boosting ROI and retention. |
| Iterate for growth | Continuous testing and refinement are the key to long-term revenue lift. |
Laying the groundwork: Data foundations for marketing decisions
Before any analysis is meaningful, your data has to be trustworthy. Too many marketing teams skip this step and end up building campaigns on numbers that are duplicated, incomplete, or siloed across platforms. The result is decisions that feel data-driven but are actually just as risky as guessing.
Start by auditing your data sources. GA4 Enhanced eCommerce setup should be your first priority for capturing funnel events and transaction data. Layer in your CRM, email platform, and any point-of-sale system so you can build a full picture of each customer. Data silos across platforms produce siloed insights, and those insights lead to flawed decisions, so integration is not optional.
Here is a quick overview of the core data types and where they typically live:
| Data type | Primary source | What it powers |
|---|---|---|
| Transaction data | E-commerce platform, POS | RFM scoring, LTV, basket analysis |
| Behavioral data | GA4, heatmaps | Funnel analysis, intent signals |
| Product data | Catalog, inventory system | Bundling, cross-sell recommendations |
| Marketing channel data | Ad platforms, email ESP | Attribution, ROAS, CAC |
Once you know where your data lives, validate it before moving forward. Check for duplicate purchase events, missing UTM parameters, and inconsistent product identifiers. These small errors compound fast when you scale your analysis. Review your ecommerce analytics checklist to make sure nothing critical is missing before you start segmenting.
Minimum data requirements for effective segmentation:
- At least 90 days of clean transaction history
- Customer identifiers that persist across sessions and channels
- Order-level line items, not just summary totals
- Channel attribution tags on every order
- Consistent product SKU or category taxonomy
Pro Tip: Think about inventory management implications when you centralize your product data. Basket analysis and segmentation outputs directly affect stock planning, so connecting these data streams early pays dividends later.
Once your data foundation is solid, you can monitor the key metrics to track without worrying that the numbers you are acting on are misleading you.
Workflow step 1: Hypotheses, KPIs, and tracking setup
With trusted data sources in place, it is time to focus on what you will measure and how. Jumping straight to dashboards without defining what question you are trying to answer is one of the most common ways marketing teams waste weeks of analytical effort.
A data-driven marketing workflow for e-commerce always starts the same way: you define a hypothesis tied to a specific business goal, then you select the KPIs that tell you whether that hypothesis is true. Everything else, your segments, campaigns, and dashboards, flows from this foundation.
Here is a simple sequence to follow:
- Write out your business goal in one sentence (example: reduce churn among second-purchase customers by 15%).
- Turn the goal into a testable hypothesis (example: if we send a personalized cross-sell offer within 7 days of the second purchase, repeat rate will increase).
- Choose the KPIs that measure success for that specific hypothesis.
- Confirm that your tracking setup actually captures those KPIs accurately.
- Build a dashboard that surfaces those numbers without noise.
For most e-commerce teams, key KPIs from transaction data include CAC (target below 33% of 12-month LTV), ROAS using data-driven attribution rather than last-click, LTV by cohort, and repeat purchase rate. Here is how they stack up:
| KPI | Definition | Benchmark target | Primary data source |
|---|---|---|---|
| CAC | Cost to acquire one customer | Under 33% of 12-mo LTV | Ad platform, CRM |
| ROAS | Revenue per ad dollar spent | Varies by channel and margin | Ad platform, GA4 |
| LTV | Total revenue per customer | Track by cohort and segment | E-commerce platform |
| Repeat rate | % customers with 2+ orders | 25-40% for healthy retention | Order data |
Review the full breakdown of ecommerce KPIs explained if you need to align your team on definitions before setting targets. Tracking clarity at this stage prevents arguments about what the numbers mean when results come in. Also study your success metrics for revenue to understand which indicators actually predict long-term growth, not just short-term campaign wins.
Workflow step 2: Customer segmentation using RFM and beyond
Once KPIs and tracking are established, it is critical to segment your customers for tailored actions. A single message sent to your entire list treats a first-time buyer the same as someone who has purchased 12 times. That approach bleeds budget and trains customers to ignore you.
RFM analysis scores every customer on three dimensions: Recency (days since last purchase), Frequency (total number of orders), and Monetary value (total spend). To score and segment your data, follow these steps:
- Pull your full customer order history for the last 12 to 24 months.
- Calculate R, F, and M values for each customer.
- Rank each dimension into quintiles (1 to 5 scale, where 5 is best).
- Combine scores to assign each customer to a named segment.
- Label segments: Champions (5-5-5), Loyal, At-Risk, and Hibernating.
Here is how RFM stacks up against broader segmentation approaches:
| Approach | Strengths | Limitations | Best use case |
|---|---|---|---|
| RFM | Simple, uses existing data | Misses non-purchase behavior | Retention, win-back campaigns |
| Behavioral | Captures intent signals | Requires richer data infrastructure | Email and ad retargeting |
| Lifecycle | Maps journey stages | Complex to maintain | Onboarding and churn prevention |
RFM is the fastest path to actionable segments because it uses data you already have. Its main limit is that it ignores browsing behavior, email opens, and product affinity signals. Supplement it with behavioral layers once the transactional foundation is running.

Pro Tip: Adjust your recency window to match your category’s natural buy cycle. A furniture brand’s “active” customer might be anyone who purchased in the last 18 months, while a consumables brand would define active as the last 60 days. Using the wrong window misclassifies large portions of your list. See how to master RFM analysis for category-specific calibration guidance.
From there, build targeted actions for each segment. Use your RFM for at-risk customers playbook to structure win-back sequences, and lean on a proven retention playbook to keep Champions and Loyal customers from drifting.
Workflow step 3: Analyzing results, attribution, and continuous improvement
With actionable segments created, it is time to measure what works and what to refine. This step is where most teams either accelerate or stall. The difference is usually discipline around attribution and a bias toward iteration.
“73% of analytics teams lack actionable dashboards, even when the underlying data exists. RFM-powered campaigns yield +30% ROI, +25% retention, and 20% less promotional waste on average.”
Routine performance checks should cover:
- Segment-level open, click, and conversion rates versus baseline
- Cohort revenue trends week-over-week, not just snapshot totals
- Segment migration: are At-Risk customers moving to Hibernating or recovering?
- Channel attribution consistency across GA4, your ad platforms, and your CRM
- Promo redemption rates by segment to catch overuse early
One critical area: avoid over-reliance on last-click attribution. Last-click systematically undercredits awareness channels and email, which leads you to cut exactly the touchpoints that warm customers before they convert. Switch to data-driven attribution models in GA4 and your ad platforms. Validate your data quality at every step to ensure the attribution signals you are reading are actually accurate.
Pro Tip: Track segment migration monthly. If your Champions segment is shrinking as a percentage of your active base, that is an early warning sign of retention problems, even if total revenue looks fine in the short term. This one check often catches problems months before they show up in headline revenue numbers.
Tie results back to your original hypothesis from Step 1. Did the test prove or disprove it? Either answer is useful. Use the merchandising workflow guide to connect product-level insights to campaign decisions, and apply your strategy for smarter growth to systematize iteration into your regular planning cycle.
What most miss about scaling data-driven marketing
Here is the uncomfortable reality: most mid-to-large e-commerce brands already have enough data. The bottleneck is almost never the data itself. It is the gap between insight and action.
Teams spend weeks building dashboards and presenting findings in review meetings, and then marketing keeps running the same segments and the same promotions anyway. The reports exist. The insights exist. The day-to-day marketing moves do not change.
Scaling a data-driven workflow is fundamentally an operational problem, not a technical one. It requires redesigning how decisions get made: who owns acting on an RFM shift, how quickly a win-back sequence launches when a Champions segment drops, and what triggers a pricing or bundling review. Operationalizing data insights means baking these triggers into your marketing calendar and team processes, not just your reporting stack.
More tools and more dashboards rarely solve this. A leaner workflow with clear ownership and automatic action triggers will outperform a sophisticated analytics stack that nobody acts on.
Take the next step: Free tools and advanced segmentation resources
You have the workflow. Now you need the right tools to execute it without a data science team standing between you and your insights.

Affinsy is built for exactly this use case. Export your order data from Shopify, WooCommerce, BigCommerce, Stripe, or any platform that produces transaction records, then upload via CSV or connect via API. The platform runs market basket analysis and RFM segmentation automatically, surfacing the product associations and customer patterns your team can act on immediately. Dig into the customer segmentation deep dive to understand how each model works, or grab the free order export plugin for WooCommerce to start pulling clean transaction data today. The permanent free tier covers up to 20,000 line items with no credit card required.
Frequently asked questions
How do you choose the right KPIs for e-commerce marketing?
Select KPIs tied directly to revenue impact, specifically CAC, ROAS, and LTV, and ensure each one maps to a specific business goal and customer lifecycle stage rather than a vanity metric.
What is the main limitation of RFM segmentation?
RFM relies entirely on purchase history, so it misses behavioral signals like browsing patterns and email engagement. Supplement it with behavioral or lifecycle data to fill those gaps.
How often should marketing teams review their data-driven workflow?
Weekly KPI and cohort reviews allow faster iteration and catch segment shifts before they become revenue problems, which static monthly reports rarely accomplish in time.
How do you avoid data quality issues in transaction analytics?
Validate for duplicate events and enforce UTM parameter consistency across all marketing channels, then centralize your data before running any segmentation or attribution analysis.
Recommended
- Understanding Data-Driven Campaign Optimization for E-Commerce - Affinsy Blog | Affinsy
- Data-Driven Marketing Strategies Guide to Boost AOV - Affinsy Blog | Affinsy
- Data-driven marketing strategies for e-commerce growth - Affinsy Blog | Affinsy
- Developing a Marketing Strategy to Maximize E-commerce Sales - Affinsy Blog | Affinsy
- 7 ventajas de la inteligencia artificial en marketing digital