
TL;DR:
- Profit marketing focuses on maximizing contribution margin and cash flow rather than just revenue or clicks. It requires measuring profit at the order and channel level, aligning marketing and finance on key metrics, and continuously reallocating budgets based on margin data. This organizational shift improves cash flow, reduces misallocated spend, and enhances product and pricing strategies.
Profit marketing is marketing run to maximize contribution margin and cash flow, not just revenue or clicks. The three things to do first: (1) measure contribution margin by channel, (2) align marketing and finance on fully-loaded CAC and LTV, (3) run price, bundle, and retention tests that move margin directly.
Start here this week:
- Pull your last 90 days of order data and calculate gross margin by acquisition channel.
- Ask finance for your fully-loaded CAC — including agency fees, creative, and internal headcount.
- Identify one pricing or bundling test you can run in the next 30 days and define the margin success metric before you launch it.
Table of Contents
- What does profit marketing actually cover?
- Why measuring marketing by profit changes everything
- Core metrics, formulas, and a worked example
- How to implement profit marketing in 60–90 days
- Tactics that move margin, not just revenue
- What data and tools do you need to measure this accurately?
- How market-basket analysis and segmentation drive measurable profit
- Common mistakes that make marketing look profitable when it isn’t
- Key Takeaways
- The real shift is organizational, not just analytical
- Affinsy turns transaction data into margin-improving campaigns
- Useful sources
What does profit marketing actually cover?
Profit-driven marketing is not a rebranding of ROI tracking. It is a fundamentally different operating model. Where revenue-focused marketing asks “how much did we sell?”, profit-focused marketing asks “how much did we keep after every cost?”
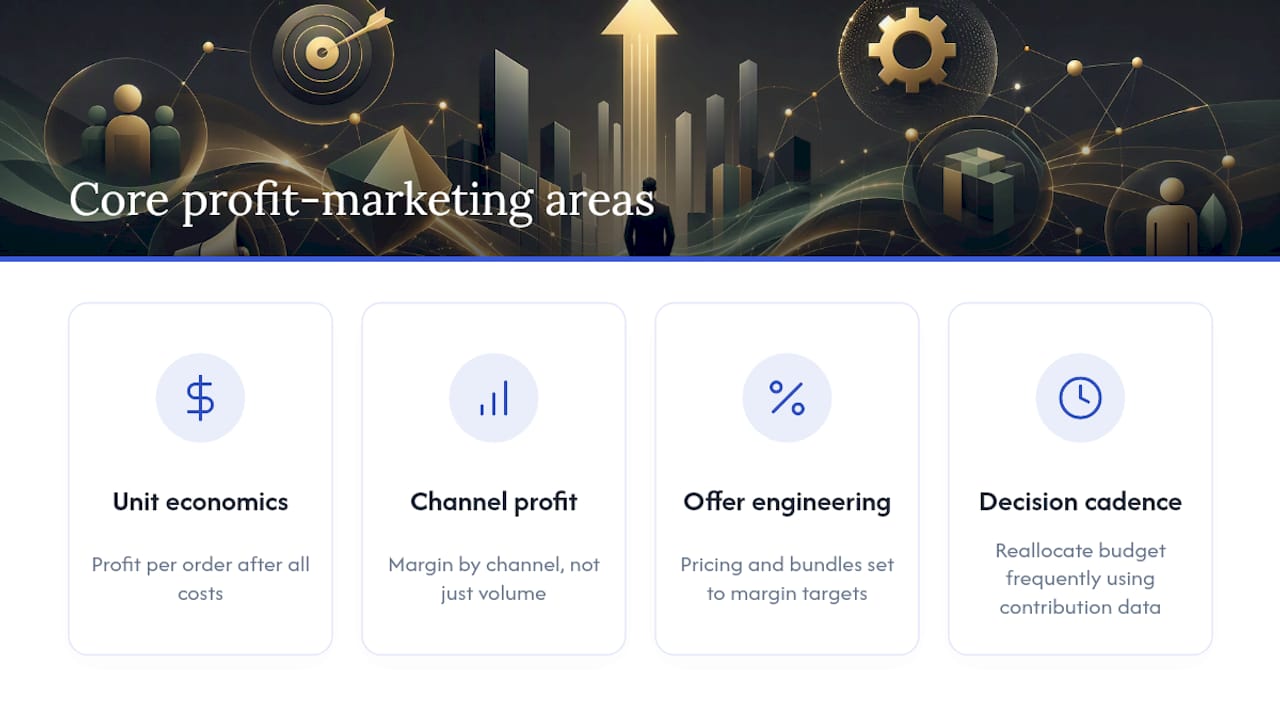
The scope covers four areas: unit economics (what each order actually earns), channel-level profitability (which acquisition sources generate margin, not just volume), offer engineering (pricing, bundles, and promotions designed around margin targets), and decision cadence (how often you reallocate budget based on contribution data rather than gut feel or last quarter’s plan).
The contrast with ROAS-first or revenue-first approaches is direct. ROAS ignores variable costs — a channel with a 6x ROAS can still produce a negative contribution margin once you account for COGS, returns, fulfillment, and payment fees. Revenue-first marketing assumes all revenue is equally valuable, which it never is when margins differ by product, channel, or customer segment.
Brand and awareness work still fits. The key is measurement: unified analytics platforms can capture both immediate conversions and longer-term brand equity impact, so awareness spend gets evaluated on its contribution to the pipeline rather than dismissed as unmeasurable.
Why measuring marketing by profit changes everything
The business case is straightforward. When marketing optimizes for revenue, budgets flow to channels that look productive on the surface but erode cash. Profit-driven marketing reframes the function from a cost center to a profit center and eliminates the “use-it-or-lose-it” end-of-year spending that plagues most marketing budgets.
Three business impacts follow from mis-measuring marketing:
- Cash-flow risk: A campaign with strong long-term ROI but a 14-month payback period can strain working capital for a business with tight cash cycles.
- Misallocated budgets: Spend concentrates in high-ROAS channels that look great in the ad platform dashboard but underperform on actual margin.
- Weak product and pricing signals: Revenue data alone cannot tell you whether a product is worth promoting; margin data can.
Aligning marketing and finance around profit metrics ends the recurring debate over what “success” means. The most common organizational failure is not bad strategy — it is two teams operating with different definitions of the same outcome. Fixing that requires shared KPIs, a joint reporting cadence, and someone accountable for the handoff between ad spend and P&L.
Core metrics, formulas, and a worked example
These are the numbers that matter. Learn the formulas once; the math is not complicated.
| Metric | Formula | Use case |
|---|---|---|
| Contribution margin per order | Revenue − COGS − variable fulfillment − returns − payment fees | Campaign-level profitability |
| Gross margin % | (Revenue − COGS) / Revenue × 100 | Product and channel benchmarking |
| ROAS | Revenue / Ad spend | Media efficiency (incomplete alone) |
| ROMI | (Contribution margin − marketing cost) / marketing cost × 100 | True marketing profit |
| Fully-loaded CAC | Total marketing spend (media + fees + headcount) / new customers | Program-level efficiency |
| LTV | Avg. order value × purchase frequency × avg. customer lifespan | Payback and budget ceiling |
| LTV:CAC | LTV / CAC | Acquisition health check |
| Payback period | Fully-loaded CAC / avg. monthly contribution margin per customer | Cash-flow planning |
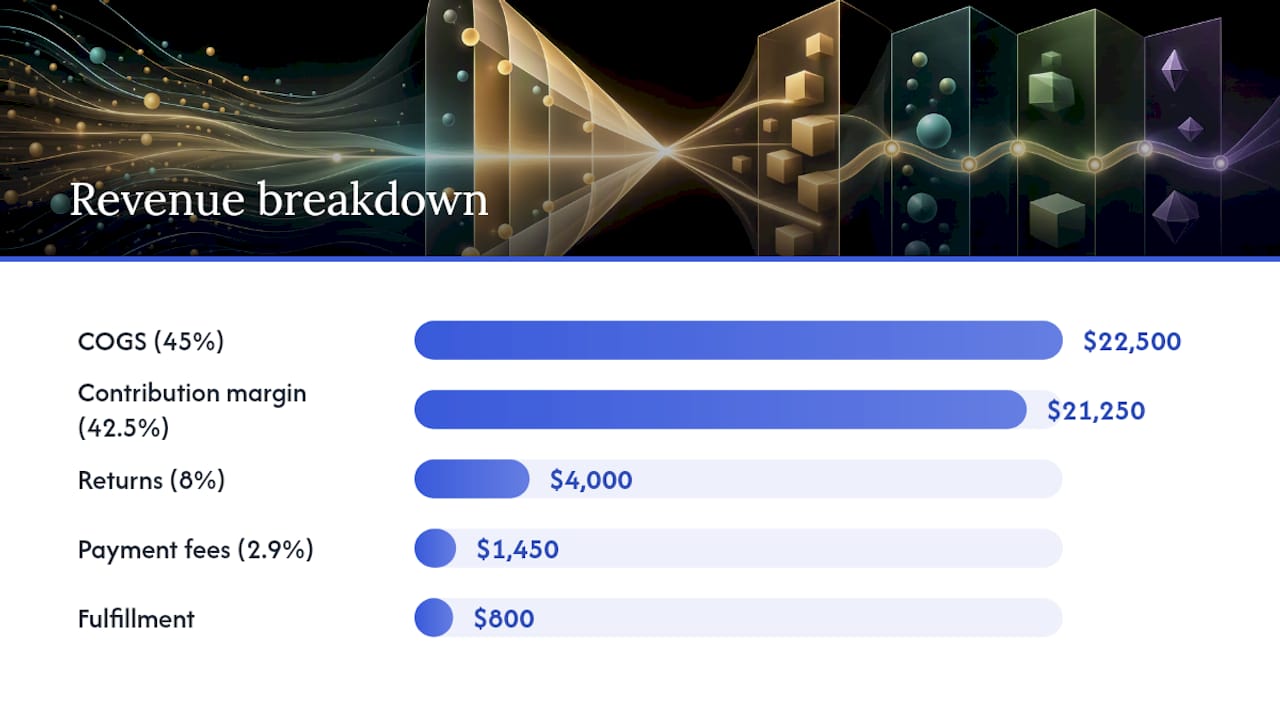
Worked example. Suppose a paid social campaign generates $50,000 in revenue from 200 orders. Average COGS is 45%, fulfillment runs $4 per order, returns average 8% of revenue, and payment fees are 2.9%. Ad spend for the campaign was $8,000.
- Gross revenue: $50,000
- COGS (45%): $22,500
- Fulfillment (200 × $4): $800
- Returns (8%): $4,000
- Payment fees (2.9%): $1,450
- Contribution margin: $21,250
- ROMI: ($21,250 − $8,000) / $8,000 × 100 = 165.6%
That same campaign’s ROAS was 6.25x — which looks excellent. But the contribution margin of $21,250 on $50,000 in revenue is a 42.5% contribution rate, and only after subtracting the $8,000 in ad spend does the true profit picture emerge.
Fully-loaded CAC commonly runs significantly higher than media-only CAC once agency fees, creative production, and internal headcount are included. If your media-only CAC is $40, your real fully-loaded CAC usually rises by 30–60%, meaning it is closer to $52–$64.
Pro Tip: For teams without clean cohort data, estimate LTV with a simple 12-month window: average order value × average annual purchase frequency. It is less precise than a full cohort model, but it is defensible, fast to calculate, and far better than ignoring LTV entirely.
Payback period matters as much as total ROI. A campaign that returns 3x over 18 months can still damage cash flow if the business needs that capital back in 6.
How to implement profit marketing in 60–90 days
This is an operational shift, not a one-time audit. Five steps, in order:
-
Align KPIs and definitions. Marketing and finance agree on one set of numbers: contribution margin per order, fully-loaded CAC, and LTV. Document the formulas and who owns each input. No shared definition, no shared truth.
-
Instrument order-level data. Every order needs channel attribution, SKU-level COGS, fulfillment cost, and return status. This is the minimum data set. Without it, you are calculating margin on averages, which hides the channels and products that are actually losing money.
-
Calculate channel contribution margin. You only need four numbers per channel: gross revenue generated, average gross margin %, total media spend including agency fees, and estimated fulfillment cost per order. Start there before building a full data stack.
-
Run a Capital Allocation Loop. Measure contribution margin by channel monthly. Identify outliers — channels with high spend but low margin. Reallocate incremental budget toward higher-margin channels. Repeat quarterly for budget planning. This continuous loop replaces end-of-year budget politics with data-driven reallocation.
-
Test offers, pricing, and retention. Reserve roughly 20% of budget for experiments. The other 80% runs proven channels at known contribution margins. Use the test budget to find the next margin improvement — a price increase, a bundle, a retention email flow.
Governance checklist:
- Monthly: marketing manager reviews channel contribution margin report with finance.
- Quarterly: joint marketing-finance session to reforecast budget based on contribution data.
- SLA: finance delivers SKU-level COGS to marketing within 5 business days of month close.
- Owner: one named person accountable for the contribution margin report — not a committee.
Tactics that move margin, not just revenue
The highest-impact levers for profit-focused advertising are not the ones most teams prioritize.
- Price testing. A 10% price increase on a stable ad budget often improves gross profit more than marginal conversion rate gains, because price flows directly to margin. Test a 7–10% price increase on your top two SKUs with a 2-week holdout. Measure contribution margin per order, not conversion rate.
- Market-basket bundling. Identify which products are frequently bought together using transaction data, then build a bundle offer priced at a 5–8% discount to the sum of parts. AOV rises, and the discount is smaller than the fulfillment savings from shipping one package. See retail analytics for bundling for a worked example.
- Retention email flows. Email carries the lowest marginal cost of any channel. Use paid acquisition to grow your list, then convert and retain via owned channels. The contribution margin on a repeat customer acquired through email is structurally higher than one acquired through paid social.
- Product-focused ad spend. Shift budget toward your highest-margin SKUs, not your highest-volume ones. Run a 30-day test reallocating 20% of paid spend from high-volume/low-margin products to high-margin ones and compare contribution margin per dollar spent.
- AOV-increasing offers. Free shipping thresholds, quantity discounts, and add-on prompts at checkout all raise AOV without proportionally raising fulfillment cost.
Mini-experiment 1 — Pricing test. Hypothesis: raising the price of Product A by 8% will not reduce unit volume enough to offset the margin gain. Metric: contribution margin per order for Product A. Success criteria: contribution margin per order increases by at least 5% over a 3-week test window.
Mini-experiment 2 — Bundle cross-sell. Hypothesis: customers who buy Product B also buy Product C within 30 days; a bundle offer at checkout will capture that revenue in one transaction. Metric: bundle attach rate and average contribution margin per transaction. Success criteria: bundle attach rate above 12% and contribution margin per transaction 10% higher than Product B alone.
Pro Tip: Prioritize experiments by expected margin lift and payback speed, not by conversion rate potential. Price and product-mix changes typically deliver larger margin gains than incremental CRO work.
What data and tools do you need to measure this accurately?
Attribution and analytics are only as good as the data feeding them. Here is what you actually need:
| Data input | Recommended source | Integration method |
|---|---|---|
| Ad platform spend | Google Ads, Meta Ads Manager | API or CSV export |
| Order-level revenue | Shopify, WooCommerce, BigCommerce | CSV export or API |
| SKU-level COGS | ERP or finance system | CSV from finance monthly |
| Fulfillment cost per order | 3PL reports or Shopify Shipping | CSV or API |
| Returns and refunds | Commerce platform | API or CSV |
| Payment processing fees | Stripe, PayPal | CSV or API |
Once those inputs are joined at the order level, you can calculate contribution margin per channel. Marketing teams should track both campaign-level ROI and program-level ROI — campaign data gives fast feedback; program-level data shows whether the whole marketing investment is profitable.
Tool categories that support this work:
- Attribution tools (e.g., Northbeam, Triple Whale): assign revenue to channels; useful but incomplete without margin data.
- BI platforms (e.g., Looker, Tableau, Google Looker Studio): join ad spend, order, and COGS data into a single contribution margin view.
- Analytics connectors (e.g., Supermetrics, Funnel.io): pull ad platform data into your BI layer automatically.
- Retail analytics platforms (e.g., Affinsy): analyze transaction data for product associations, customer segments, and cross-sell patterns that feed margin-improving campaigns.
For reporting cadence: run media data daily for pacing decisions, reconcile with finance data weekly, and produce a full contribution margin report monthly. Automating retail analytics reduces the manual overhead of that monthly reconciliation significantly.
How market-basket analysis and segmentation drive measurable profit
Here is a concrete workflow you can replicate. An e-commerce brand exports 12 months of transaction data as a CSV. They upload it to Affinsy, which runs market basket analysis to surface product associations — which items are bought together, in what sequence, and at what frequency. Simultaneously, RFM segmentation identifies high-value customers at risk of churning and recent one-time buyers who have not returned.
The team then:
- Builds a bundle offer around the top product pair identified by MBA.
- Exports the “at-risk high-value” RFM segment from Affinsy to Klaviyo.
- Runs a targeted win-back email campaign to that segment with the bundle offer.
- Measures contribution margin for that cohort over 60 days versus a holdout group.
The measurement is clean because the cohort is defined before the campaign runs. You are not attributing revenue after the fact — you are measuring a margin lift against a control group.
Affinsy users have reported revenue lifts of up to 40% from combined segmentation and MBA workflows, though results vary by catalog size, margin structure, and campaign execution. The free tier (up to 20K line items, no credit card required) is enough to run a first MBA and RFM pass on most mid-size catalogs.
Pro Tip: Export your RFM segments as CSV and upload them directly to your email platform. You do not need a native integration — the segment file is the integration.
Common mistakes that make marketing look profitable when it isn’t
These are the measurement traps that produce confident-looking reports and bad decisions.
- Optimizing for ROAS without margins. A 7x ROAS on a product with 20% gross margin and high return rates is likely unprofitable. Always join ROAS to contribution margin before making budget decisions.
- Ignoring fulfillment and returns. For physical goods, fulfillment and returns can consume 10–20% of revenue. Excluding them from channel math overstates profitability on every channel.
- Counting influenced revenue as generated revenue. If a retargeting campaign “influenced” a customer who would have purchased anyway, attributing 100% of that revenue to the campaign inflates its apparent contribution. Use incrementality testing or holdout groups to separate genuine lift from coincidence.
- Forgetting payback period. A subscription business can tolerate a 12-month payback. A DTC brand selling one-time purchases cannot. Know your cash cycle before setting CAC targets.
- Using media-only CAC. If your reported CAC excludes agency fees, creative costs, and the time your team spends managing campaigns, you are underpricing your acquisition and overestimating channel profitability.
Quick audit red flags:
- A channel shows high ROAS but its contribution margin is below your blended average.
- Payback period exceeds 12 months for a non-subscription business.
- Marketing and finance report different revenue numbers for the same period.
- No one on the team can name the contribution margin for your top three acquisition channels.
Key Takeaways
Profit marketing works when marketing and finance share one set of metrics, measure contribution margin at the order level, and reallocate budget continuously based on what those numbers show.
| Point | Details |
|---|---|
| Measure contribution margin first | Calculate revenue minus COGS, fulfillment, returns, and payment fees by channel before any budget decision. |
| Use fully-loaded CAC | Include agency fees, creative, and headcount; media-only CAC understates true acquisition cost by 30–60%. |
| Run a Capital Allocation Loop | Review channel contribution margin monthly; reallocate budget quarterly based on margin data, not last year’s plan. |
| Prioritize price and bundle tests | Price increases and bundle offers typically deliver larger margin gains than conversion rate optimization alone. |
| Affinsy for segmentation and MBA | Export transaction data to Affinsy to identify high-margin bundle opportunities and at-risk customer segments for targeted campaigns. |
The real shift is organizational, not just analytical
Most marketing teams already have enough data to run profit-first. What they lack is the organizational agreement to use it.
The hardest part of shifting to profit-driven marketing is not the math — it is getting marketing and finance to agree on what the numbers mean before a campaign launches, not after. When those two functions operate with different definitions of success, every post-campaign review becomes a negotiation rather than a learning. Marketing points to ROAS; finance points to margin. Neither is wrong, but neither is complete.
The practical fix is a joint operating rhythm: a monthly contribution margin review where both teams look at the same report, agree on what worked, and make budget decisions together. That single change — one shared report, one shared meeting — does more for marketing profitability than any new tool or attribution model.
On the trade-off between LTV investment and short payback: not every campaign should optimize for immediate margin. Acquisition campaigns for high-LTV customer segments can justify longer payback periods, provided the business has the cash to carry them. The discipline is knowing which campaigns are which, and not letting LTV arguments become a blanket excuse for every underperforming channel.
Protect your test budget. The 80/20 split — 80% on proven channels, 20% on experiments — is not a creativity exercise. It is how you find the next margin improvement before your competitors do. Teams that cut test budgets in a down quarter are the ones who have nothing new to scale when conditions improve.
Affinsy turns transaction data into margin-improving campaigns
If the workflows in this article sound useful but the data assembly feels like the hard part, that is exactly what Affinsy is built for. Export your order history from Shopify, WooCommerce, Stripe, or any platform that produces transactional data, upload it as a CSV, and Affinsy runs market basket analysis and RFM customer segmentation on it automatically. No data science skills required, no direct integrations to configure.
The output is a ranked list of bundle opportunities and exportable customer segments you can push directly to Klaviyo, MailerLite, or Omnisend for targeted campaigns. You measure the contribution margin lift by cohort, and you know within 60 days whether the test worked. The free tier covers up to 20K line items with full product access and no credit card required — enough to run a first MBA and RFM pass on most mid-size catalogs. Paid plans start at $49/month for larger datasets and API access.
There are multiple valid ways to implement profit marketing, and Affinsy is one recommended option specifically for the segmentation and market-basket workflows described here. Start with a free account and run your first analysis this week.
Useful sources
- Executive conversation on profits (Think with Google) — Google’s strategic case for shifting digital marketing KPIs from revenue to profit; useful for leadership buy-in conversations.
- Profit-driven marketing: aligning marketing goals with financial outcomes (Resident / Go Promotional) — Practitioner guide on creating a shared source of truth between marketing and finance.
- How to Measure True Marketing Profit by Channel (Exacti) — Detailed walkthrough of channel-level contribution margin calculation and why ROAS misleads.
- Marketing ROI (NetSuite) — Covers unified analytics approaches for measuring both direct-response and brand campaigns on a profit basis.
- Marketing That Pays: Understanding Profit-Driven Strategies (Rhythm Collective) — Explains payback period as a cash-flow risk metric alongside total ROI.
- How to Calculate Marketing ROI (TheCalcu) — Practical formulas and the 80/20 budget testing guideline; good reference for teams building their first profit dashboard.
- Marketing ROI: Campaign to Revenue Impact (Martech Pulse) — Layered ROI tracking approach covering campaign, program, and overall marketing levels; particularly useful for B2B teams.
Recommended
- Beyond the Basket: 5 Advanced MBA Lenses to Reveal Your Hidden Revenue - Affinsy Blog | Affinsy
- Market Basket Analysis Guide: Boost Your Sales Effectively - Affinsy Blog | Affinsy
- Data-Driven Merchandising Workflow: 23x Sales Growth Guide - Affinsy Blog | Affinsy
- Segmentation + market basket analysis: 40% more revenue - Affinsy Blog | Affinsy