
TL;DR:
- Custom reports embed business-specific logic directly into the data, reducing errors and saving analysis time. They enable cross-department alignment and break data silos, providing operational speed and depth. Building these reports requires clear metric definitions, accurate data modeling, and iterative development to ensure consistent, valuable insights.
Custom reports are defined as data outputs built around an organization’s specific business logic, metrics, and decision-making structure, rather than a vendor’s default template. Generic business intelligence platforms force analysts to translate raw data into business context manually. That translation layer costs time, introduces errors, and often produces insights that don’t match how a team actually operates. The role of custom reports is to close that gap entirely. Over 60% of analytics projects fail because standard BI platforms cannot align with an organization’s specific decision-making logic. That failure rate alone makes the case for purpose-built reporting.
What is the role of custom reports in ecommerce decision-making?
Custom reports embed business logic directly into the data layer. Instead of pulling a standard sales report and then manually adjusting for your return rate, your margin structure, or your subscription cohort logic, a custom report does that work at the query level. The result is a report that answers your actual question, not a generic approximation of it.

The operational gains are measurable. Targeted data blending and custom logic produce 3.2x higher efficiency in metrics like NPS renewals compared to standard templates. That figure reflects what happens when a report is built to match the exact conditions of a business process rather than a generic workflow.
Custom reports also break down data silos. An ecommerce team tracking customer satisfaction alongside inventory levels and support ticket volume needs data from three separate systems. A custom report pulls those sources into a single view, so a merchandising manager and a customer success lead can work from the same numbers without reconciling three separate exports.
Key benefits of custom reports for ecommerce teams include:
- Faster decisions: Analysts spend less time reformatting data and more time acting on it.
- Reduced interpretation errors: Business logic is baked in, so the report means the same thing to every reader.
- Cross-department alignment: One report can serve finance, marketing, and operations simultaneously.
- Metric specificity: You define what “active customer” or “high-value order” means for your business, not your BI vendor.
Pro Tip: Prioritize the three reports your team checks most often. Build those first as custom outputs. The time savings from those three alone will justify the broader investment and build internal momentum.
How do custom reports differ from generic BI platforms?
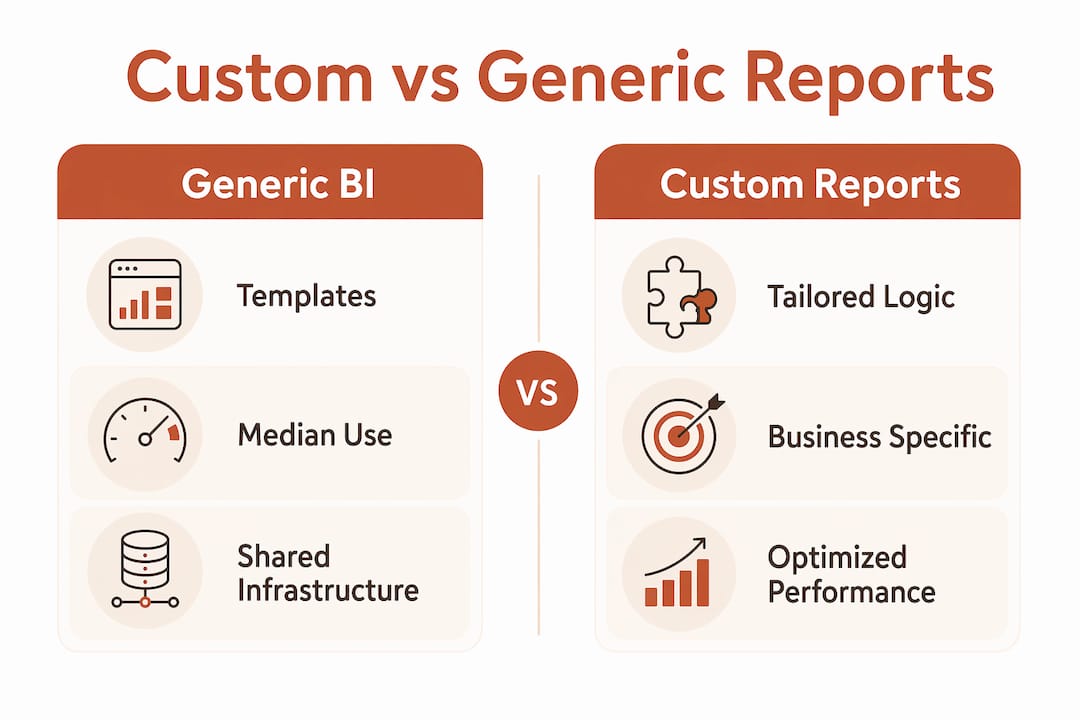
Generic BI platforms are built for the median use case. They work well for teams with simple, standard reporting needs. The problem appears when a business grows past that median. At that point, teams hit what practitioners call the “template ceiling,” the point where no combination of existing report templates produces the insight the business actually needs.
Custom builds eliminate the template ceiling and remove per-seat licensing costs that scale against you as your team grows. Generic platforms charge per user. Custom reporting infrastructure scales with server capacity instead. For a 50-person analytics team, that difference in cost structure is significant.
Performance is another gap. Generic platforms run queries against shared infrastructure with generalized optimization. Custom reports run direct queries against your own data models, tuned to your schema. Query times drop, and the outputs reflect your proprietary logic rather than a vendor’s interpretation of it.
| Dimension | Generic BI platforms | Custom reporting |
|---|---|---|
| Business logic | Vendor-defined templates | Built to your exact specifications |
| Licensing cost | Per-seat, scales with headcount | Server-based, scales with data volume |
| Query performance | Shared infrastructure | Direct, schema-optimized queries |
| Data sources | Platform-native connectors | Any source you can query |
| Flexibility | Limited to template parameters | Unlimited within your data model |
The practical answer for most ecommerce teams is a hybrid approach. Ready-made reports handle daily KPIs like revenue, orders, and traffic. Custom reports handle complex decisions like cohort-level churn analysis, multi-channel attribution, or product bundling performance. That combination delivers both operational speed and analytical depth.
Pro Tip: Avoid replacing your entire BI setup at once. Identify the two or three reports where generic templates consistently fail you, build custom versions of those, and expand iteratively. Full replacement projects stall. Incremental wins ship.
Best practices for creating effective custom reports
The most common reason custom reports fail is that teams skip the data modeling step and jump straight to visualization. Defining raw data models and business logic before building any visualization is the single most important step in custom report development. If the underlying model is wrong, every chart built on top of it is wrong too.
A practical build sequence for ecommerce custom reports looks like this:
- Define the business question. Write the exact question the report must answer. “Which product categories drive repeat purchases within 30 days?” is a good question. “Show me sales data” is not.
- Map the data sources. Identify every table, field, and system the answer requires. Document the join logic and any known data quality issues before writing a single query.
- Establish metric definitions. Decide what “repeat purchase” means in your data. Is it the same SKU? The same category? The same customer ID? Write it down and get sign-off from the stakeholders who will use the report.
- Build the data model first. Create the underlying query or data transformation before touching any visualization tool. Test it against known outputs to confirm accuracy.
- Add visualization last. Choose chart types based on how the audience reads data, not on what looks impressive. A table often communicates more clearly than a chart for operational reports.
- Automate refresh and alerting. Manual data pulls create lag and introduce human error. Schedule automated refreshes and set threshold alerts so the report surfaces problems without anyone having to check it.
Clear metric definitions and data lineage documentation reduce discrepancies and build data trust across departments. Without that documentation, two analysts will define the same metric differently, and the report loses credibility.
The final discipline is balance. Not every report needs to be custom. Over-customizing operational reports creates maintenance debt. Reserve custom builds for reports that directly influence high-stakes decisions.
How do custom reports drive ecommerce growth in practice?
The most powerful application of custom reports in ecommerce is multi-source integration. Combining CRM data, marketing spend, and customer feedback into a single report gives teams a unified view that no single platform can produce natively. A team running paid acquisition alongside email retention can see customer acquisition cost and lifetime value in the same report, broken down by channel and cohort.
Role-based reporting is another growth driver that most teams underuse. An executive needs a one-page summary of revenue, margin, and churn. A merchandising analyst needs SKU-level sell-through rates and return reasons. A custom reporting layer can produce both from the same underlying data model, formatted for each audience. That specificity means every stakeholder acts on information that is relevant to their decisions, not a generic dashboard they have to mentally filter.
Embedding AI into custom reports shifts analytics from describing what happened to predicting what will happen. Natural language querying against your own proprietary database eliminates the data privacy concerns that come with third-party AI tools. The AI productivity gains available to analytics teams that build this capability into their reporting infrastructure are substantial. Teams that have built AI into their ecommerce reporting workflows report faster cycle times and higher forecast accuracy.
The business impact compounds over time. Organizations using multiple active custom reports achieved 27% faster sales cycles and 34% higher data completeness in their CRM systems. Those numbers reflect behavioral change. When a report is built to answer the exact question a team faces, the team uses it consistently, and consistent use drives better data hygiene and faster action.
Key Takeaways
Custom reports outperform generic BI by embedding business logic directly into the data layer, eliminating the translation overhead that causes most analytics projects to fail.
| Point | Details |
|---|---|
| Define logic before visualization | Build your data model and metric definitions before touching any chart or dashboard tool. |
| Use a hybrid approach | Run ready-made reports for daily KPIs and custom reports for complex, high-stakes decisions. |
| Iterate, don’t replace | Start with your highest-pain reports and expand custom builds incrementally to reduce risk. |
| Document everything | Clear metric definitions and data lineage prevent conflicting insights across departments. |
| Embed AI for prediction | Adding AI to custom reports shifts output from descriptive to prescriptive analytics. |
Why I think most teams build custom reports in the wrong order
After working with ecommerce data teams across dozens of growth-stage brands, the pattern I see most often is this: a team decides to build custom reports, picks a visualization tool, and starts designing dashboards before anyone has agreed on what “revenue” means in their database. Three months later, the finance team and the marketing team are looking at two different revenue numbers from the same report, and trust in the entire analytics function collapses.
The fix is unglamorous. Spend the first two weeks writing metric definitions, not building charts. Get a product manager, a finance lead, and a data analyst in the same room and agree on every calculated field before a single query runs. That process feels slow. It is the reason some custom reporting projects succeed and others become expensive shelfware.
The other thing I’d push back on is the idea that custom reports are only for large enterprises. A 15-person ecommerce brand with a Shopify store and a solid CSV export can build meaningful custom reports using tools like Affinsy without a data science team. The role of dashboards in ecommerce is well understood. The role of the underlying custom report that feeds that dashboard is less discussed, and that’s where the real competitive advantage lives.
Looking ahead to 2026 and beyond, the teams that will win on analytics are the ones treating their reporting infrastructure as a product, not a project. That means version control, documentation, stakeholder feedback loops, and iterative improvement. It also means building AI querying into the data layer now, before it becomes table stakes. The window to build a proprietary analytics advantage is open. It won’t stay open indefinitely.
— Mateusz
How Affinsy supports custom analytics for ecommerce teams
Affinsy is built for ecommerce teams that want custom analytical outputs without hiring a data science team. The platform analyzes historical transaction data to surface product association patterns and customer segmentation insights, using market basket analysis and RFM segmentation as its core analytical engines.
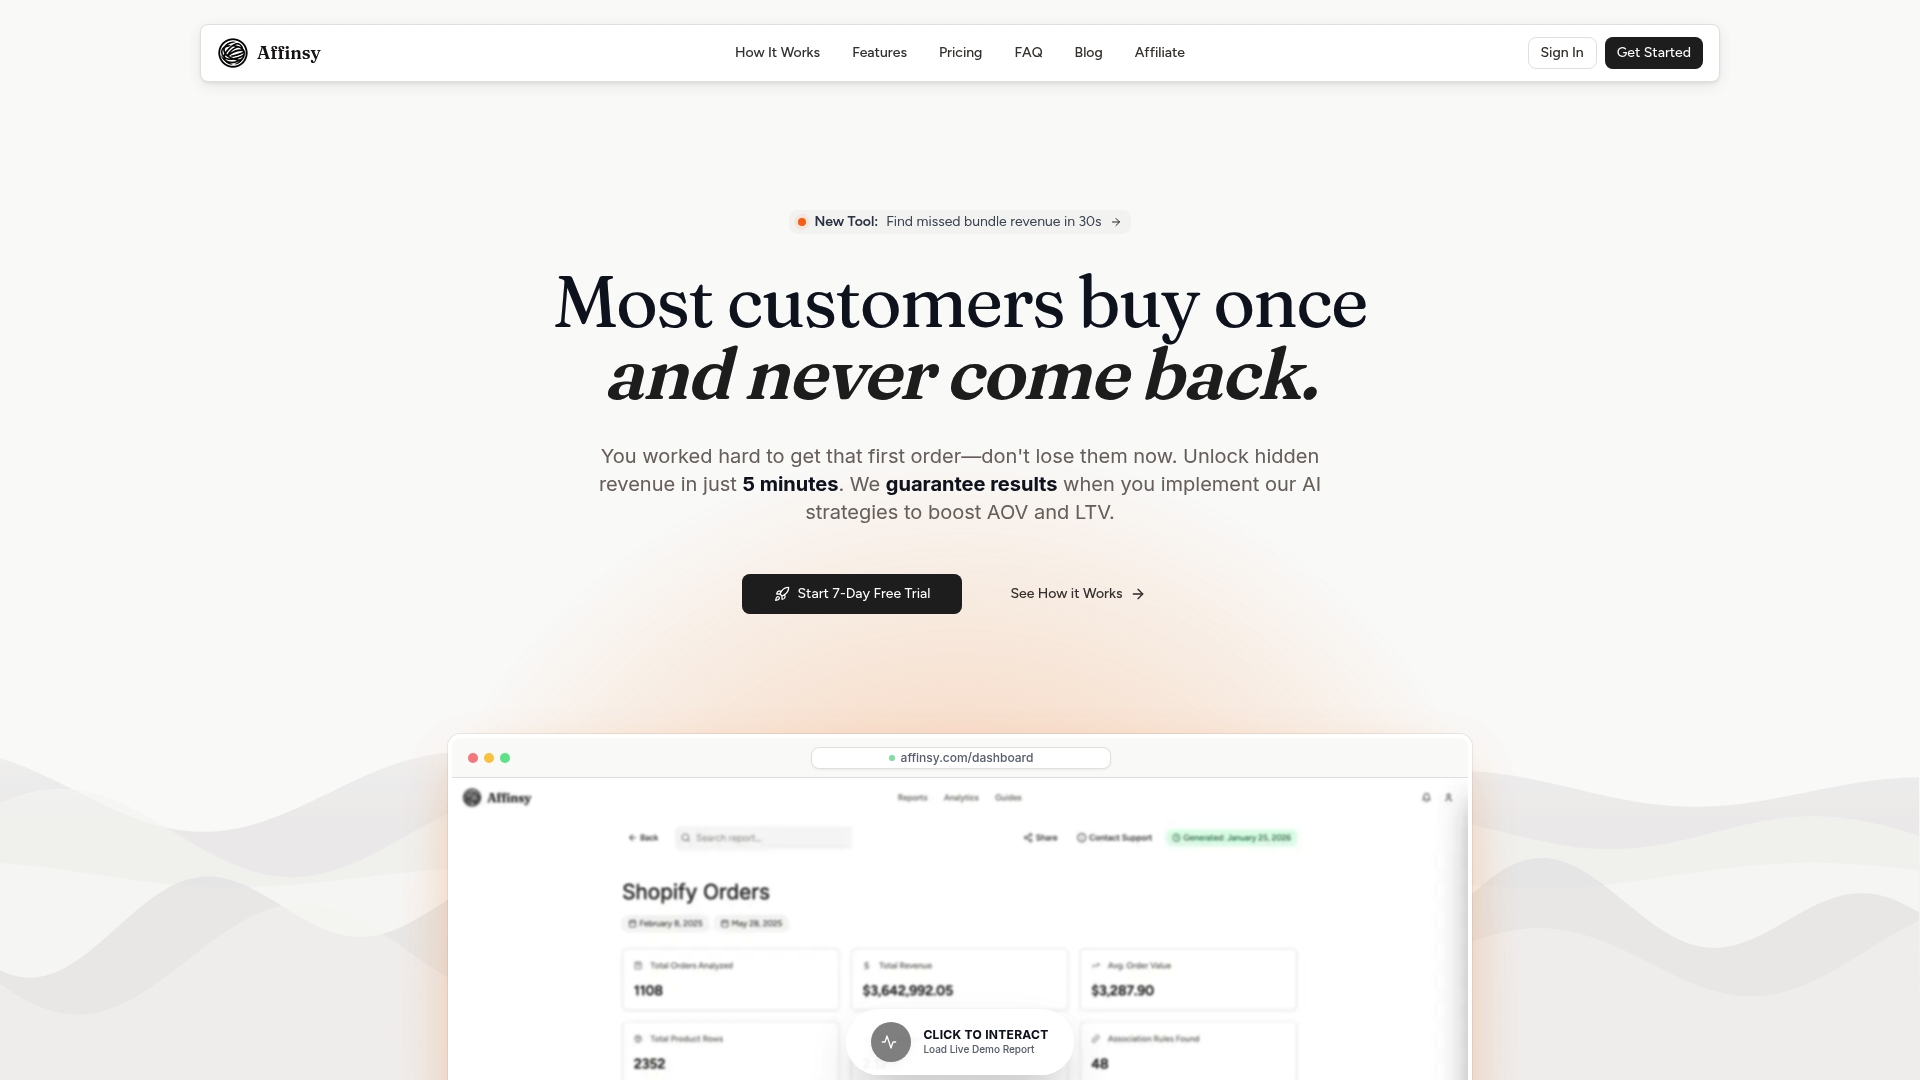
Teams connect via API, CSV upload, or MCP, exporting order data from Shopify, WooCommerce, BigCommerce, Stripe, or any transactional system. The platform’s free tier supports up to 20,000 line items with full product access and no credit card required. For teams ready to go deeper, market basket analysis and customer segmentation outputs feed directly into the custom reporting workflows described throughout this article. Pro plans start at $49/mo, with Max at $199/mo for larger datasets and API access.
FAQ
What is the role of custom reports in ecommerce?
Custom reports align data outputs with a business’s specific metrics and decision logic, replacing generic templates that require manual interpretation. They reduce analysis time and improve decision accuracy across departments.
Why do generic BI platforms fail growing ecommerce teams?
Over 60% of analytics projects fail because standard BI platforms cannot match an organization’s specific decision-making logic. As teams grow, generic templates hit a ceiling that custom builds are designed to break through.
How do you create a custom report that actually gets used?
Start by writing the exact business question the report must answer, then define your metrics and data sources before building any visualization. Reports built on agreed-upon logic get adopted. Reports built on assumptions get ignored.
What is the difference between a dashboard and a custom report?
A dashboard displays live KPIs for ongoing monitoring. A custom report answers a specific analytical question using tailored logic, often pulling from multiple data sources. The role of reporting tools in retail covers both, but they serve different purposes in a reporting stack.
Can small ecommerce teams benefit from custom reports?
Yes. A small team with clean transactional data and a clear business question can build effective custom reports using CSV-based tools without a dedicated data engineering team. The key is starting with one high-impact question rather than trying to replace an entire BI platform at once.
Recommended
- Ecommerce Reporting Guide: Optimize Store Growth Easily - Affinsy Blog | Affinsy
- E Commerce Analysis Report Guide for 2025 Success - Affinsy Blog | Affinsy
- Data Export in Ecommerce Analytics: Boost Store Insights - Affinsy Blog | Affinsy
- How to create actionable sales reports for e-commerce - Affinsy Blog | Affinsy