
Multi-store ecommerce makes sense when your business genuinely needs separate storefronts for distinct brands, regions, or buyer segments. The fastest path to cross-store intelligence is straightforward: export transaction data from each store via CSV, API, or webhook into an AI analytics layer, then push segments to your marketing tools.
- Business triggers that justify multi-store: international expansion with localized pricing and tax rules, separate brand identities targeting different audiences, or regulated catalogs requiring distinct product sets (B2B vs. B2C, for example).
- Simplest analytics route: export order data from Shopify, WooCommerce, BigCommerce, or Stripe into a platform like Affinsy via CSV upload or API, run market basket analysis (MBA) and RFM segmentation across all stores, then sync segments to Klaviyo or Omnisend.
- Quick warning: adding stores multiplies operational complexity. Every new storefront means more testing, more maintenance, and more data governance work. If your real need is localization or a wider catalog, solve it with content rules or a headless front end first.
Table of Contents
- What is multi-store ecommerce, and who actually needs it?
- When should you actually adopt multi-store?
- What are the main multi-store architectures and their trade-offs?
- How do you unify transaction data across multiple storefronts?
- What does implementation actually cost for a mid-size brand?
- Which KPIs should you track consistently across stores?
- How do you launch or consolidate stores without breaking analytics?
- What platform and integration categories should you evaluate?
- How does Affinsy implement the recommended analytics pipeline?
- How do multi-store setups affect taxation and compliance?
- How do you keep branding and customer experience consistent across storefronts?
- What are the biggest inventory management challenges across multiple stores?
- Key Takeaways
- The real cost of multi-store is in the data, not the storefronts
- Affinsy turns your multi-store transaction data into cross-sell and retention intelligence
- Useful sources and suggested next reads
What is multi-store ecommerce, and who actually needs it?
Multi-store ecommerce means running multiple distinct storefronts, each with its own URL, branding, and customer experience, all managed from a shared backend or a unified analytics layer. The storefronts can share inventory, pricing rules, and product data, or operate independently depending on your architecture.
Common use cases include:
- International or localized stores: separate storefronts for the US, EU, and APAC markets with local currencies, languages, and tax configurations.
- Brand portfolios: a parent company running two or more distinct brands that should not share a storefront identity.
- B2B and B2C split: different pricing, catalog access, and checkout flows for wholesale buyers versus retail customers.
- White-label or reseller scenarios: partners selling under their own brand using your backend catalog.
One distinction worth making early: a multi-vendor marketplace is not the same thing. A marketplace requires commission logic, vendor payouts, and data isolation between sellers. Multi-store is for a single brand running multiple storefronts. Confusing the two leads to expensive custom development.
When should you actually adopt multi-store?
Multi-store is appropriate when business growth demands it, not when it sounds architecturally elegant. Use this ordered checklist:
- New country or language market with distinct tax rules, currency, and compliance requirements.
- Brand segmentation need where two audiences must not see the same storefront identity.
- Pricing or contract differences that cannot be handled by customer groups or price lists in a single store.
- Fulfillment or regulatory requirements that vary by region or product category.
Skip multi-store when you have a single audience growing in volume, when localization can be handled with a headless front end or content rules, or when your team lacks the developer hours to maintain multiple environments.
Pro Tip: Before committing, run a 30-day pilot. Launch one additional store, export its order data alongside your primary store’s data, and test whether your analytics pipeline can handle the combined dataset. If the pilot breaks your reporting, the full rollout will too.
What are the main multi-store architectures and their trade-offs?
Three patterns cover most real-world deployments.
| Architecture | Best for | Implementation burden | Data integration | Vendor lock-in risk |
|---|---|---|---|---|
| Platform-native multi-store | Mid-market brands on Shopify Plus or BigCommerce | Low to medium (built-in tools) | Native cross-store reporting, limited depth | High — tied to platform’s data model |
| Separate stores + unified backend | Enterprise brands with complex catalog or fulfillment needs | High (custom dev required) | Requires ETL or middleware | Medium — depends on backend choice |
| Separate stores + unified analytics layer | Resource-constrained teams or mixed-platform stacks | Low (export-based) | CSV/API/webhook into analytics platform | Low — platform-agnostic |

Platforms that centralize backend data are powerful for scaling, but vendor lock-in and migration difficulty push many enterprise brands toward headless or composable architectures. The export-based analytics approach is the most portable: you are not locked into any platform’s reporting, and you can swap storefronts without losing your analytics history.
Key trade-offs to plan for:
- SEO: each storefront needs its own keyword strategy and hreflang configuration. Shared content across stores creates duplicate-content risk.
- Inventory complexity: stock visibility across stores requires either a shared inventory system or a reliable sync layer.
- Maintenance cadence: platform updates on one store may break integrations on another.
How do you unify transaction data across multiple storefronts?
Multi-store architectures do not automatically produce unified analytics. You must normalize and centralize customer IDs and order records before any cross-store analysis is meaningful.
Three ingestion paths, ranked by engineering effort:
- Scheduled CSV export and upload: export order data from each store on a daily or weekly schedule, normalize the schema, and upload to your analytics platform. Zero engineering required, latency of 24 hours or more.
- Direct API ingestion: connect each store’s order API to your analytics layer. Requires developer setup, but latency drops to near real-time and the process runs automatically.
- Real-time webhooks into an ETL layer: each store fires order events to a webhook endpoint that normalizes and loads data continuously. Highest engineering effort, lowest latency, best for high-volume stores.
| Ingestion method | Latency | Engineering effort | Ideal use case |
|---|---|---|---|
| CSV upload | 24h+ | None | Small teams, pilot projects |
| API ingestion | Minutes to hours | Medium | Mid-size brands, regular reporting |
| Webhook + ETL | Near real-time | High | High-volume, real-time segmentation |
Schema normalization checklist before analysis: dedupe customer IDs, unify SKUs across stores, normalize currency and tax fields, standardize timestamps to UTC, and tag each order record with its source store.
Pro Tip: Use email address plus a hashed external ID as your canonical customer identifier. This preserves cross-store identity without exposing raw PII in your analytics dataset, and it survives platform migrations.
What does implementation actually cost for a mid-size brand?
Brands with limited developer resources often prefer platforms with built-in multi-store support to avoid the high total cost of ownership from custom builds. Here is a realistic breakdown:
- CSV-based pipeline: 1–5 developer hours for schema mapping and upload automation. Pilot ready in one week.
- API integration: 20–60 developer hours depending on platform API complexity and normalization requirements. Expect 2–6 weeks to production.
- Webhook + ETL pipeline: 60–120+ developer hours. Plan for 6–12 weeks including QA.
Operational risks to budget for: platform API rate limits that throttle data sync, data quality gaps from missing SKUs or duplicate order IDs, inventory reconciliation failures when stock is shared across stores, and ongoing maintenance when platforms push breaking API changes.
A realistic milestone timeline for a mid-size brand: pilot store live and exporting data by week 2, schema validated and analytics running by week 4, full rollout with automated sync by week 8–12.
Which KPIs should you track consistently across stores?
Cross-store analytics only deliver value when you track the right metrics and validate data quality before acting on them. Segmenting customers by behavior across stores is where the real lift comes from.
| Metric | Calculation note | Why it matters cross-store |
|---|---|---|
| AOV (Average Order Value) | Total revenue / total orders per store | Reveals pricing and bundling gaps between stores |
| ARPU (Average Revenue Per User) | Total revenue / unique customers (deduped) | Requires cross-store customer ID deduplication |
| LTV (Lifetime Value) | Sum of all orders per customer across all stores | Understated if stores are analyzed in isolation |
| Cross-store retention | % of customers who purchased in store A and later in store B | Identifies cross-sell opportunities between storefronts |
| Market-basket affinity | Product co-purchase frequency across stores | Surfaces bundling and upsell opportunities |
| RFM segments | Recency, Frequency, Monetary scored per customer | Drives targeted re-engagement campaigns |
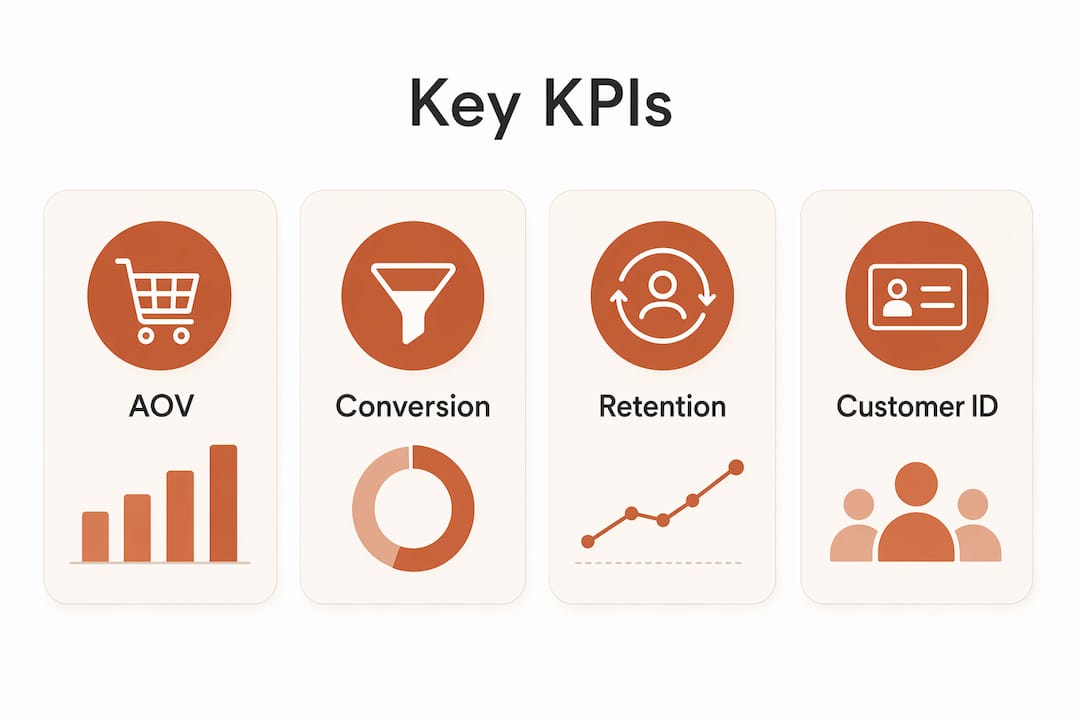
Data quality checks to run before trusting these numbers: order dedupe rate (flag duplicate order IDs), missing SKU rate (orders with unresolvable product references), and cross-store customer match rate (what percentage of customers appear in more than one store).
How do you launch or consolidate stores without breaking analytics?
A sequenced checklist reduces the risk of losing historical data or misattributing revenue during a migration or new store launch.
- Map all existing inventory and product IDs across stores.
- Sync product data to a PIM or central catalog before launch. A PIM and headless CMS are the standard pattern for consistent product data across storefronts.
- Run test exports from each store and validate schema alignment.
- Map customer IDs using the canonical identifier strategy (email + hashed external ID).
- Run a pilot ingestion with 30–90 days of historical orders and validate record counts.
- QA cohort tests: compare a known customer cohort’s order history in the source system against the unified dataset.
- Validate RFM segments against known customer behavior before using them in campaigns.
- Gradual cutover: run old and new pipelines in parallel for at least two weeks before decommissioning the old one.
Rollback triggers to define in advance: more than 2% order ID mismatch rate, more than 5% missing SKU rate, or any segment export that does not match expected cohort sizes.
Intelligent order routing to local fulfillment centers should be configured before launch, not retrofitted, since it affects both delivery performance and inventory data accuracy.
What platform and integration categories should you evaluate?
Rather than ranking vendors, focus on four category questions:
- Native multi-store platforms (Shopify Plus, BigCommerce): low implementation burden, strong built-in tooling, higher lock-in. Best for brands committed to a single platform ecosystem.
- Headless and composable stacks: composable commerce patterns increase analytics portability and help brands avoid lock-in. Higher upfront cost, more flexibility long-term.
- Separate stores with an analytics layer: the most platform-agnostic approach. Each store exports data independently; the analytics layer normalizes and unifies it.
- Marketplace vs. multi-store: if you need vendor payouts and commission logic, you need marketplace infrastructure, not multi-store.
| Evaluation criterion | What to ask |
|---|---|
| Implementation burden | How many developer hours to connect all stores? |
| Data integration options | Native cross-store reporting, or export + analytics layer? |
| Cost shape | Per-store licensing vs. flat platform fee vs. usage-based? |
| Scalability | Can you add a store without a new integration project? |
| Analytics capability | Can you get cross-store LTV, RFM, and MBA from the platform natively? |
For payment infrastructure, Stripe’s API makes it straightforward to ingest transaction data from multiple stores into a unified dataset, regardless of which storefront platform each store uses. ESP and CRM sync patterns (Klaviyo, Omnisend, MailerLite) work best when customer segments are exported from a centralized analytics layer rather than individually from each store. AI-driven marketing activations built on unified transaction data consistently outperform store-by-store campaigns.
How does Affinsy implement the recommended analytics pipeline?
Affinsy ingests historical order data from any storefront via CSV upload, API, or webhook and normalizes it into a platform-agnostic dataset. There are no direct store integrations required. You export order data from Shopify, WooCommerce, BigCommerce, Stripe, or any system that produces transactional records, then feed it into Affinsy through your preferred method.
From that unified dataset, Affinsy runs:
- Market basket analysis: surfaces product co-purchase patterns and bundling opportunities across all stores combined.
- RFM customer segmentation: scores every customer on recency, frequency, and monetary value using the full cross-store order history.
- Automated hypothesis ranking: prioritizes which product associations and segments are worth acting on first.
- Segment export: pushes customer segments directly to Klaviyo, Omnisend, or MailerLite for campaign activation.
Pricing is tiered by dataset size. The free tier covers up to 20,000 line items with full product access and no credit card required. Pro is $49/month; Max is $199/month. Enterprise pricing is available for higher volumes. The free tier is large enough to run a meaningful pilot on 3–6 months of historical orders for most mid-size brands.
For AI-powered customer segmentation across multiple storefronts, the export-based approach means you are never locked into a platform’s native analytics, and your segment history survives any future platform migration.
How do multi-store setups affect taxation and compliance?
Each additional storefront can create new tax obligations. In the United States, economic nexus thresholds vary by state. Selling into a new state from a dedicated regional storefront may trigger sales tax registration requirements under that state’s rules, regardless of where your business is incorporated.
For international stores, VAT, GST, and customs duties add another layer. A US-based brand launching a UK storefront, for example, must register for UK VAT once sales exceed the current threshold and collect the correct rate at checkout. Getting this wrong creates liability that compounds quickly.
Practical steps: use a tax compliance tool (Avalara or TaxJar integrate with most major platforms) configured per storefront, not globally. Audit your nexus exposure before each new store launch, not after. Keep tax configuration in version control so platform updates do not silently reset rates.
Data privacy compliance also multiplies with each new market. A European storefront requires GDPR-compliant data handling, including how you export and store customer records for analytics. Tag each customer record with its source market and apply the appropriate retention and consent rules before loading data into your analytics layer.
How do you keep branding and customer experience consistent across storefronts?
Consistency does not mean identical. Each storefront should feel native to its market while sharing the underlying brand logic: the same visual system, the same tone of voice, and the same service standards.
A design token system (shared color variables, typography scales, and component libraries) lets each storefront customize surface-level elements without drifting from the brand. Pair this with a headless CMS that serves localized content from a single content model. Editors update the global brand assets once; each storefront pulls the localized version automatically.
Customer experience consistency is harder than visual consistency. The same return policy, the same loyalty program rules, and the same support response times across stores matter more to customers than pixel-perfect design alignment. Define these service standards centrally and enforce them operationally before worrying about font choices.
For SEO, each storefront needs its own keyword strategy. Shared content across stores without hreflang tags creates duplicate-content problems that suppress rankings for all stores simultaneously. Treat each storefront’s SEO as a separate project with its own content calendar.
What are the biggest inventory management challenges across multiple stores?
Overselling is the most common failure mode. When two storefronts share a physical inventory pool without a real-time sync layer, a customer on store A can purchase the last unit of a SKU while a customer on store B is mid-checkout for the same item.
Best practices to prevent this:
- Centralize inventory in a single source of truth (your ERP, WMS, or platform inventory system) and push availability updates to each storefront via API, not manual sync.
- Set safety stock buffers per storefront based on order velocity. A storefront with higher traffic needs a larger buffer to absorb sync latency.
- Use SKU normalization across stores. The same physical product should carry the same SKU everywhere. Variant SKUs that differ by store make inventory reconciliation and analytics nearly impossible.
- Audit inventory data quality before and after each platform update. Platform migrations frequently corrupt SKU mappings.
Warehouse routing to the nearest fulfillment center reduces delivery time and shipping cost, but it requires accurate real-time inventory visibility at the warehouse level, not just the storefront level. Build that visibility before you optimize routing.
Key Takeaways
Multi-store ecommerce delivers real value only when business needs genuinely require separate storefronts. The export-based analytics pipeline (CSV, API, or webhook into an AI layer) is the most portable and cost-effective path to cross-store intelligence for most mid-size brands.
| Point | Details |
|---|---|
| Adopt multi-store for the right reasons | International expansion, brand segmentation, or regulatory separation justify the complexity; volume growth alone does not. |
| Normalize data before analysis | Dedupe customer IDs, unify SKUs, and tag each record with its source store before running any cross-store KPI. |
| Match ingestion method to dev capacity | CSV upload works for pilots; API or webhook ingestion is needed for automated, low-latency reporting at scale. |
| Track LTV and RFM across all stores combined | Analyzing stores in isolation understates customer value and misses cross-store retention and bundling opportunities. |
| Affinsy as the analytics layer | Affinsy ingests order data via CSV, API, or webhook from any platform and outputs MBA, RFM segments, and ESP-ready exports on a free tier up to 20K line items. |
The real cost of multi-store is in the data, not the storefronts
The conventional wisdom treats multi-store ecommerce as primarily a platform decision. Pick the right platform, configure your stores, and the analytics will follow. That framing gets teams into trouble.
The platform choice is the easy part. The hard part is data governance: normalizing customer identities across stores, maintaining SKU consistency through platform updates, and keeping your analytics pipeline running when one of your storefronts migrates or changes its API version. Teams that skip data governance early spend months later trying to reconcile conflicting numbers from stores that were never set up to talk to each other.
The other underestimated risk is SEO cannibalization. Two storefronts targeting the same keywords in the same language will compete against each other in search results. This is not a theoretical concern. It shows up in traffic data within weeks of launch and takes months of content work to untangle.
My honest recommendation: treat the analytics pipeline as a first-class deliverable, not an afterthought. Define your canonical customer ID strategy before you launch store two. Set up your data export and normalization layer in the pilot phase, not after you have six months of fragmented data to clean up. And if you are evaluating whether multi-store is even the right move, run the pilot export first. If you cannot get clean, unified data from two stores in a test environment, you are not ready to scale to three.
Affinsy turns your multi-store transaction data into cross-sell and retention intelligence
Most analytics tools require you to pick a platform and stay there. Affinsy works differently: upload order exports from any combination of Shopify, WooCommerce, BigCommerce, or Stripe stores, connect via API, or stream via webhook, and get a unified dataset ready for market basket analysis and RFM customer segmentation within minutes.
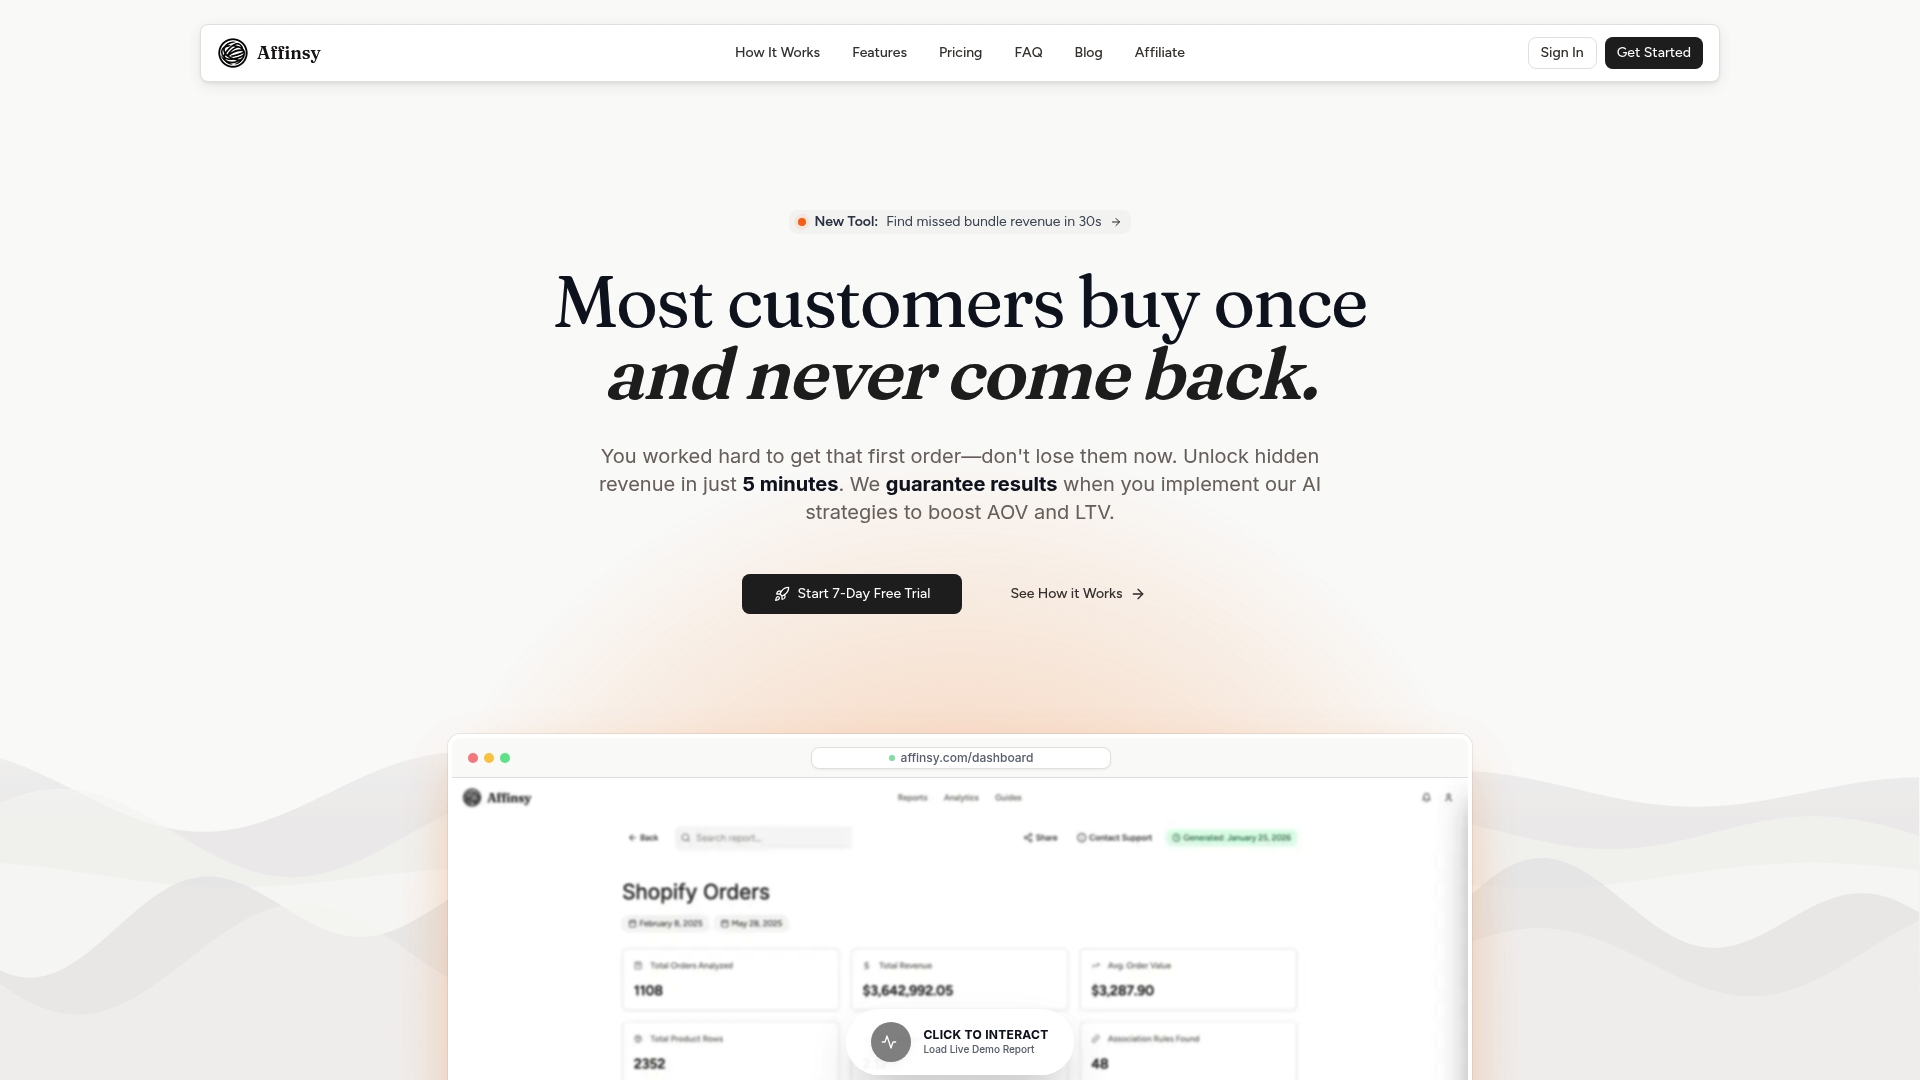
The free tier offers access to a substantial amount of product data without requiring a credit card, sufficient to run a pilot on mid-size stores, validate your cross-store customer identity strategy, and export initial RFM segments to Klaviyo or Omnisend before moving to a paid plan. For teams ready to scale, Pro starts at $49/month and Max at $199/month, with enterprise pricing available for larger datasets.
Start with a CSV export from your two highest-revenue stores, upload to Affinsy, and run your first cross-store MBA report. The results will tell you whether your stores are cannibalizing each other’s customers or building complementary audiences.
Useful sources and suggested next reads
- Multi-Store Ecommerce: Benefits + Managing From One Platform — BigCommerce’s overview of multi-store architecture, use cases, and platform considerations.
- Multi-Store Ecommerce: A Complete Guide — Salesforce’s guide covering customer analytics, fulfillment, and unified commerce patterns.
- Ecommerce Platform Comparison: Cost, Speed, and Enterprise Fit — Shopify’s breakdown of implementation burden and TCO across platform types.
- Multi-Site eCommerce: How to Scale Multiple Shops — SCAYLE’s practical guide to centralized backend architecture and PIM integration.
- AI Customer Segmentation for Profitable Growth — How Affinsy uses AI to build segments that increase retention and LTV across multiple storefronts.
- Best AI Analytics Tools for Ecommerce — Comparative guide to analytics tools and pipelines for ecommerce teams.
- How to measure brand awareness using AI analytics — Practical suggestions for measuring brand signals across storefronts with analytics tools.
Suggested next steps: export 90 days of order history from your two largest stores, validate cross-store customer identity using the email + hashed ID method, and set a KPI dashboard tracking cross-store LTV, RFM distribution, and market-basket affinity before the end of your pilot period.
Recommended
- Data-Driven Merchandising Workflow: 23x Sales Growth Guide - Affinsy Blog | Affinsy
- Ecommerce Reporting Guide: Optimize Store Growth Easily - Affinsy Blog | Affinsy
- Data-Driven Ecommerce Strategies for Smarter Growth - Affinsy Blog | Affinsy
- Understanding Ecommerce Growth Strategies Guide - Affinsy Blog | Affinsy