
TL;DR:
- Many brands only track sales but do not analyze the underlying performance metrics.
- Deep sales analysis includes methodologies like cohort, trend, and attribution analysis to optimize growth.
- Adopting structured analysis and predictive tools creates a competitive advantage and sustainable growth.
Most e-commerce brands track their sales numbers. Very few actually analyze them. There’s a meaningful difference between pulling a revenue report at the end of the month and running a structured sales performance analysis, which involves tracking, measuring, and evaluating sales activities and metrics to assess effectiveness, identify trends, and surface opportunities for optimization. That gap between tracking and analyzing is where growth stalls, retention problems go unnoticed, and profitability quietly erodes. This guide will show you how to close it.
Table of Contents
- The foundations: What is sales performance analysis?
- Core methodologies: How to analyze sales performance effectively
- Beyond the numbers: Spotting hidden trends and pitfalls
- Actionable insights: Using sales analysis for retention optimization
- Leveraging predictive analytics: The next frontier in sales performance
- Our perspective: Why deep sales performance analysis separates market leaders
- Tools and resources to start your sales performance journey
- Frequently asked questions
Key Takeaways
| Point | Details |
|---|---|
| Holistic analysis is essential | Sales performance analysis goes beyond basic reports to uncover growth opportunities. |
| Retention impacts profits | A small lift in customer retention can dramatically boost long-term e-commerce profit. |
| Beware common pitfalls | Misused attribution models and siloed data can hide true performance trends. |
| Predictive analytics matters | Machine learning enables accurate forecasting and proactive revenue strategies. |
| Leaders invest in depth | Top e-commerce brands succeed by deeply embedding sales performance analysis into their culture. |
The foundations: What is sales performance analysis?
Sales performance analysis is not a dashboard. It’s not a weekly revenue email. It’s a structured process of evaluating whether your sales activities are actually working and where the friction points live. According to a widely cited definition, sales performance analysis is the process of tracking, measuring, and evaluating sales activities and metrics to assess effectiveness in meeting goals, identify trends, bottlenecks, and opportunities for optimization.
For e-commerce brands, that means going beyond top-line revenue. It means understanding which customer segments are driving sustainable growth, which products are quietly cannibalizing each other, and where in the funnel you’re losing buyers you already paid to acquire. The benefits of sales data analysis extend well beyond reporting. Done right, analysis becomes the engine for smarter product decisions, better marketing spend, and more loyal customers.
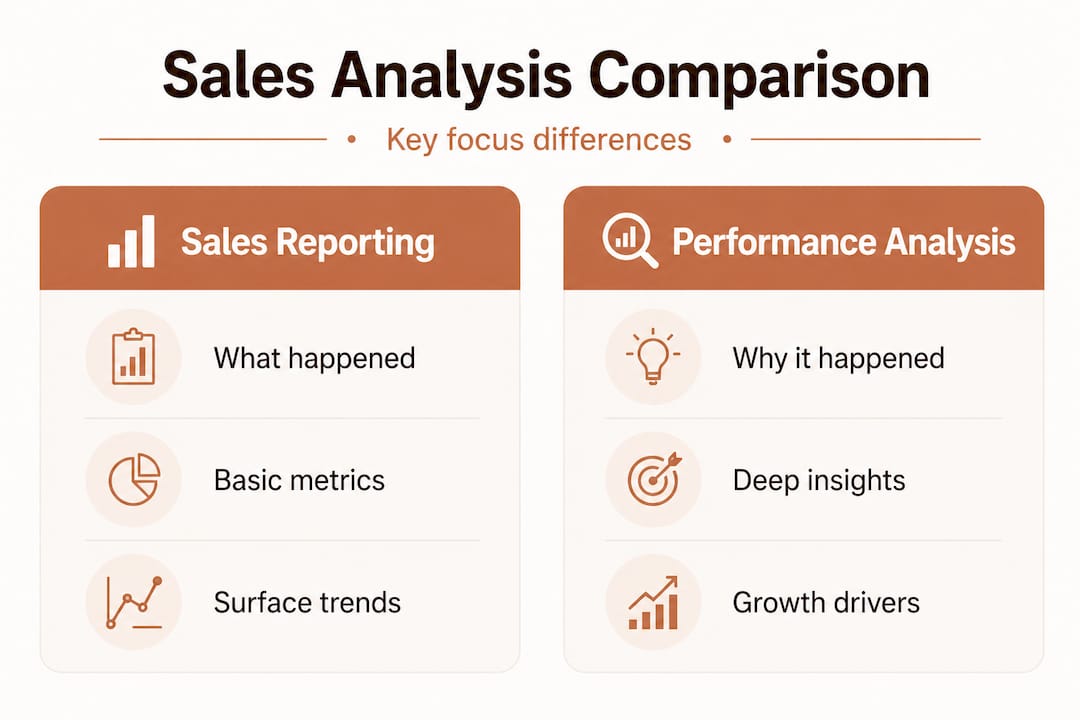
Here’s a quick comparison of what separates basic sales reporting from true performance analysis:
| Dimension | Sales reporting | Sales performance analysis |
|---|---|---|
| Focus | What happened | Why it happened and what to do next |
| Output | Numbers and charts | Actionable recommendations |
| Frequency | Periodic snapshots | Continuous, iterative |
| Audience | Executives | All decision-makers |
| Impact | Visibility | Optimization and growth |
The strategic role of sales performance analysis is to connect your data to decisions. Without it, you’re flying with instruments but no map. With it, you can spot a retention problem before it becomes a revenue crisis, or identify a cross-sell opportunity before a competitor does.
Key areas where sales performance analysis creates direct value:
- Identifying growth bottlenecks at specific funnel stages or customer segments
- Tracking goal progress against realistic benchmarks, not just last month’s numbers
- Surfacing hidden opportunities in product mix, pricing, and customer behavior
- Flagging early warning signs like declining cohort retention or shrinking average order value
“Analysis without action is just expensive observation. The brands that win are the ones that build feedback loops between their data and their decisions.”
Core methodologies: How to analyze sales performance effectively
With a clear definition in place, let’s explore the practical methods that bring sales performance analysis to life. There are five core methodologies every e-commerce marketing manager should understand, and each one answers a different strategic question.
Key methodologies include sales pipeline analysis, trend and forecast analysis, cohort analysis, attribution analysis, and predictive analytics using machine learning. Here’s how each one works in practice:
-
Sales pipeline analysis examines conversion rates at each stage of the buying journey. If 60% of users add to cart but only 2% complete a purchase, that’s a checkout friction problem, not a traffic problem.
-
Trend and forecast analysis tracks performance over time to surface seasonal patterns, growth trajectories, and early signs of decline. It answers: are we growing, plateauing, or sliding?
-
Cohort analysis groups customers by acquisition date or channel and tracks their behavior over time. This is the most powerful tool for understanding true retention, because it isolates variables that aggregate metrics hide.
-
Attribution analysis maps which marketing touchpoints actually contributed to a conversion. This is where most brands get it wrong, but more on that shortly.
-
Predictive analytics uses machine learning to forecast future outcomes based on historical patterns. It’s no longer reserved for enterprise brands with data science teams.
To put these methods in context, here are the e-commerce benchmarks you should be measuring against:
| Metric | Benchmark range |
|---|---|
| Repeat purchase rate | 28.2% |
| Retention rate (transactional) | 25–30% |
| Retention rate (subscription) | 68–72% |
| Returning customer revenue share | 40–60% |
| E-commerce conversion rate | 1.9–3.3% |
Understanding key ecommerce KPIs in relation to these benchmarks gives you a baseline for what “good” looks like. Without benchmarks, you’re evaluating performance in a vacuum.
Pro Tip: Don’t run all five methodologies at once when you’re starting out. Begin with cohort analysis and trend analysis. These two together will reveal your most urgent retention and growth problems within the first few weeks of consistent tracking.
The real power of data-driven decision making comes when you layer these methods together. A trend analysis might show declining revenue in Q3. Cohort analysis reveals that customers acquired through paid social have a 40% lower 90-day retention rate than organic customers. Pipeline analysis shows those paid social customers drop off after the first purchase. Now you have a complete picture, not just a number.
Beyond the numbers: Spotting hidden trends and pitfalls
While methodologies are valuable, they’re only as good as the insights drawn. Let’s examine where standard analysis can mislead or hide crucial patterns.
The three most common analytical traps in e-commerce sales performance analysis are attribution errors, siloed data, and lagging indicators that mask early warning signs.
The attribution problem is bigger than most brands realize. Last-click attribution overcredits paid search by 30 to 50%, while systematically undervaluing upper-funnel channels like content, social, and email. That means brands using last-click models are routinely overspending on paid search and underfunding the channels that actually build awareness and intent. The result is a marketing mix that looks efficient on paper but is quietly degrading brand health over time. For a broader look at how retail attribution insights play out across different retail contexts, the patterns are consistent: final touchpoints get the credit, early touchpoints get cut.

Siloed data is a retention killer. When your marketing data, customer service data, and transactional data live in separate systems and nobody connects them, retention collapses can go unnoticed for quarters. A customer who buys once, contacts support twice with unresolved issues, and never returns is invisible in your revenue reports. But that pattern, multiplied across thousands of customers, is a serious business problem hiding in plain sight.
Lagging indicators tell you what already happened. Revenue, orders, and conversion rates are all lagging. By the time they drop, the damage is done. Smart brands track leading indicators like Net Promoter Score (NPS), product return rates, and support ticket volume. A low NPS score is a reliable predictor of future churn, and it shows up weeks or months before revenue declines.
Key pitfalls to monitor actively:
- Over-reliance on aggregate metrics that mask segment-level problems
- Ignoring zero-purchase cohorts (customers who signed up but never bought)
- Treating all revenue equally without accounting for margin, return rate, or lifetime value
- Confusing correlation with causation in trend analysis
“The brands that get blindsided by retention crises aren’t the ones with bad data. They’re the ones with good data they never connected.”
Pro Tip: Set up a monthly predictive analytics in retail review that specifically looks at leading indicators. If NPS drops two months in a row, treat it as a revenue alert, not a customer service problem.
Actionable insights: Using sales analysis for retention optimization
Having addressed the pitfalls, let’s look at actionable strategies to move the needle on customer retention and real profits using smart sales analysis.
Retention is where the math gets compelling fast. A 5% retention lift can boost profit by 25 to 95%, depending on your business model and margins. That’s not a marginal improvement. That’s a business transformation hiding inside a single metric.
Here’s a practical step-by-step approach to using cohort analysis for retention optimization:
-
Segment your customers by acquisition month and channel. Don’t lump all customers together. Paid social customers behave differently from organic search customers, and treating them as one group hides actionable differences.
-
Track the 30, 60, and 90-day repeat purchase rates for each cohort. The target benchmark is greater than 20% repeat purchases within 90 days. Cohorts falling below this threshold need immediate attention.
-
Identify which cohorts show declining customer retention rate (CRR) over time. A cohort that starts strong but drops sharply after 60 days often signals a product quality or post-purchase experience problem.
-
Map the customer journey for your best-performing cohorts. What did they buy first? What email sequences did they receive? What was their support experience? Replicate those patterns for new customers.
-
Test targeted win-back campaigns for cohorts showing early churn signals. A personalized offer sent at day 45 to customers who haven’t repurchased is far more effective than a blanket discount sent to everyone.
-
Monitor returning customer revenue share monthly. Healthy e-commerce brands see 40 to 60% of revenue coming from returning customers. If that number is trending down, your acquisition costs are rising relative to lifetime value.
Using AI for sales segmentation can dramatically accelerate this process. Instead of manually slicing cohorts in spreadsheets, AI-powered tools can surface the segments most at risk and recommend specific interventions based on behavioral patterns.
Pro Tip: Build a simple retention scorecard that tracks three numbers every month: 90-day repeat purchase rate, returning customer revenue share, and average order value by cohort. These three metrics together give you a reliable pulse on retention health without requiring a data science degree to interpret.
Leveraging predictive analytics: The next frontier in sales performance
Finally, as e-commerce evolves, predictive analytics is fast becoming a must-have for brands seeking next-level performance. Here’s how to get started.
Predictive analytics uses machine learning to forecast outcomes based on historical patterns. In e-commerce, this means predicting which customers are likely to churn before they do, which products are likely to spike in demand before inventory runs out, and which offers are most likely to convert for specific customer segments.
The practical applications are significant:
- Churn prediction models flag customers whose purchase frequency, engagement, or browsing behavior suggests they’re drifting away. You can intervene with targeted retention offers before they’re gone.
- Demand forecasting uses historical sales patterns and external signals like seasonality impact on sales to predict inventory needs with far greater accuracy than manual planning.
- Offer optimization uses purchase history and segment data to personalize promotions, increasing conversion rates without blanket discounting.
- Customer lifetime value (CLV) prediction identifies your highest-value future customers early, so you can prioritize them in acquisition and nurture campaigns.
The analytics trends driving AI ROI in 2026 show that brands integrating predictive tools into their standard analytics stack are outperforming competitors on both acquisition efficiency and retention. This isn’t a future capability. It’s a current competitive advantage.
Action steps for adopting predictive analytics in your stack:
- Start with a clean, consolidated transaction dataset. Predictive models are only as good as the data you feed them.
- Identify one high-value use case first, such as churn prediction or demand forecasting, rather than trying to do everything at once.
- Use platforms built for predictive analytics in e-commerce that don’t require you to build models from scratch.
- Establish clear success metrics before you launch any predictive initiative, so you can measure actual impact.
Pro Tip: The biggest mistake brands make with predictive analytics is treating it as a one-time project. Predictive models need to be retrained regularly as customer behavior evolves. Build a quarterly model review into your analytics calendar from day one.
Our perspective: Why deep sales performance analysis separates market leaders
Here’s the uncomfortable truth: most e-commerce brands are not actually doing sales performance analysis. They’re doing sales reporting with a nicer interface. They pull numbers, build charts, present them in meetings, and call it analysis. Then they wonder why their decisions don’t move the needle.
Market leaders operate differently. They use their data to challenge assumptions, not confirm them. When a cohort underperforms, they ask why, not just how much. When a channel shows strong last-click conversion, they pressure-test it against multi-touch attribution before increasing budget. Research shows that top performers enforce structured methodologies and handle objections 843% more effectively than average performers, while quota attainment across the industry remains low, with only 31% of reps exceeding targets. That gap isn’t about tools. It’s about discipline and analytical culture.
The difference between brands that scale and brands that stall is rarely the quality of their data. It’s the quality of their questions. Deep analysis means asking: which customer segments are actually profitable after returns and support costs? Which acquisition channels produce customers who buy again? What does our best customer’s first 90 days look like, and how do we engineer that experience for everyone?
Automation in retail analytics is making this kind of deep analysis accessible to brands that don’t have dedicated data teams. But technology alone won’t create an analytical culture. That requires leadership commitment to acting on insights, not just collecting them.
Getting sales performance analysis right isn’t a growth lever you can pick up and put down. It’s the foundation of every smart decision your brand makes, from product development to marketing spend to customer experience. The brands that treat it as a core competency rather than a quarterly exercise are the ones that will still be growing five years from now.
Tools and resources to start your sales performance journey
If you’re ready to put these strategies into practice, Affinsy offers a range of tools and guides to get started with confidence.

Affinsy’s AI-powered analytics platform is built specifically for e-commerce brands that want to move from reporting to real analysis. It analyzes your historical transaction data to surface customer segmentation patterns, product associations, and retention signals that standard reporting tools miss completely. You can explore the predictive analytics glossary to sharpen your understanding of the methods covered in this article, dig into the market basket analysis guide to discover hidden cross-sell opportunities in your existing catalog, or use Affinsy’s customer segmentation tools to build the cohort-based retention programs that drive real profit lifts. The permanent free tier covers up to 20,000 line items with no credit card required, so there’s no barrier to getting started today.
Frequently asked questions
What are the most important metrics in sales performance analysis for e-commerce?
Key metrics include conversion rate, repeat purchase rate, retention rate, returning customer revenue share, and cohort-level performance. E-commerce benchmarks show a repeat purchase rate of 28.2%, retention of 25 to 30% for transactional models, and returning customers accounting for 40 to 60% of revenue.
How does cohort analysis improve customer retention?
Cohort analysis isolates groups of customers by acquisition date or channel, making it possible to spot retention drops early and intervene with targeted campaigns before churn accelerates. The target benchmark is greater than 20% repeat purchases within 90 days, and a 5% retention lift can boost profit by 25 to 95%.
Why is last-click attribution unreliable for analyzing e-commerce campaigns?
Last-click attribution systematically overcredits paid search by 30 to 50% while undervaluing upper-funnel channels like content and social, leading brands to misallocate marketing budgets toward final touchpoints rather than the channels that actually build purchase intent.
How can predictive analytics drive higher e-commerce sales?
Predictive analytics uses machine learning to forecast customer behavior, demand patterns, and churn risk, enabling brands to act on likely future outcomes rather than reacting to past results after the opportunity has passed.
What retention rate should e-commerce brands target?
Aim for a repeat purchase rate above 20% within 90 days of a customer’s first order, and track retention rates against the 25 to 30% benchmark for transactional models to identify cohorts that need targeted re-engagement.
Recommended
- Guide to E-Commerce Data Analysis for Increased Sales - Affinsy Blog | Affinsy
- 7 Essential Sales Data Analysis Tips for E-commerce Growth - Affinsy Blog | Affinsy
- Sales pattern analysis: maximize e-commerce growth - Affinsy Blog | Affinsy
- Sales Data Analysis: Unlocking E-Commerce Growth - Affinsy Blog | Affinsy
- How Smart POS Systems Help You Identify Best-Selling Products - Switch&Save
- Boost Your Success with Customer Engagement in Retail | BonusQR