
What is churn prediction, and how does it work?
Churn prediction is the process of using historical customer data, behavioral signals, and machine learning algorithms to identify which customers are likely to stop buying, cancel subscriptions, or disengage before they actually leave. The output is a risk score assigned to each customer or account, ranked from low to high probability of churning. That score drives everything: who gets a retention offer, who gets a check-in call, and who gets left alone.
The mechanics are straightforward. Models train on past churn events, learning which combinations of signals, such as declining login frequency, increased support tickets, missed feature adoption milestones, or payment delays, tend to precede cancellation. Once trained, the model scores current customers continuously. The practical goal is to flag at-risk accounts well in advance of churn, allowing retention efforts to intervene effectively.
Key behavioral and transactional signals that feed churn models include:
- Login frequency and session recency: Declining engagement is often the earliest warning sign.
- Feature adoption gaps: Customers who never use core features are far more likely to leave.
- Support ticket volume: A spike in complaints or unresolved issues correlates strongly with churn risk.
- Payment history: Failed payments, downgrades, or billing disputes signal involuntary or voluntary churn.
- Purchase recency and frequency: In transactional businesses, long gaps between orders are a primary indicator.
Common modeling techniques include logistic regression, decision trees, random forests, gradient boosting methods like XGBoost, and neural networks. Advanced models can reach prediction accuracy rates of 70–85% when properly implemented, giving customer success teams a concrete list of accounts to prioritize rather than guessing.
Why churn prediction is critical for business revenue
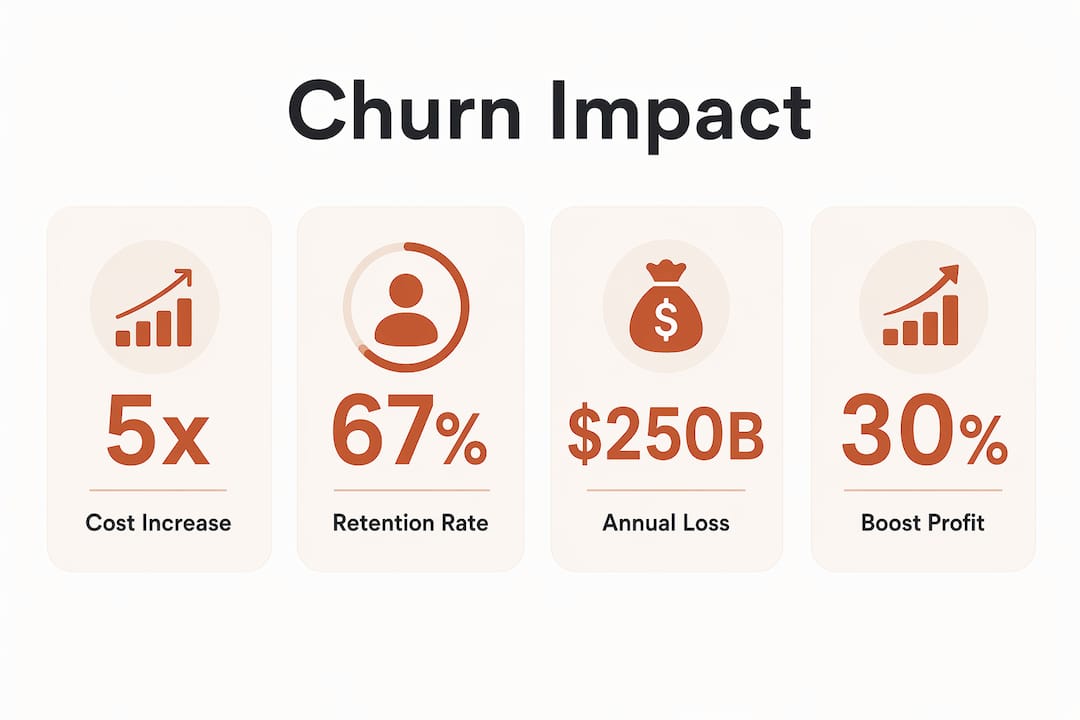
Retaining an existing customer costs far less than winning a new one. Research confirms that acquiring a new customer can run five to twenty-five times more expensive than keeping one you already have. That math alone makes early churn detection one of the highest-return investments a business can make.

Beyond cost savings, churn prediction directly shapes revenue forecasting, marketing budget allocation, and customer lifetime value. When you know which accounts are at risk, you stop spending retention budget on customers who were never going to leave and start concentrating resources where they actually move the needle. Businesses implementing advanced churn prediction techniques can improve retention rates by 5–10%, which research links to profit increases of 25–95%.
Industries and business models that benefit most include:
- SaaS and subscription services: Monthly recurring revenue makes even small churn rate changes immediately visible on the bottom line.
- Telecommunications: High customer acquisition costs make retention economics especially favorable.
- Retail and e-commerce: Repeat purchase behavior is the engine of profitability; losing a loyal buyer is expensive.
- Banking and financial services: Long customer relationships and cross-sell potential make early warning systems highly valuable.
- Healthcare and insurance: Policy renewals and ongoing care relationships depend on identifying disengagement early.
Pro Tip: Don’t treat churn prediction as a one-time model build. The value compounds when you run it continuously, updating risk scores as customer behavior evolves week over week.
Main challenges that make churn prediction hard to get right
The biggest technical obstacle is data imbalance. In most businesses, churners are a small fraction of the total customer base, which means models trained naively will simply predict “no churn” for everyone and still look accurate. Correcting for this requires deliberate resampling strategies or profit-weighted evaluation metrics.

Defining churn consistently is a separate problem that trips up even experienced teams. Failure to standardize the churn definition across business models leads directly to inaccurate models and unreliable risk scores. A SaaS company might define churn as non-renewal; a retail brand might use 90 days without a purchase. Neither definition is wrong, but mixing them or leaving them vague destroys model reliability.
Other significant challenges include:
- Model interpretability: Complex ensemble and deep learning models often function as black boxes. Knowing a customer scored 87% churn risk is only useful if you understand why, so you can act on it.
- Concept drift: Customer behavior shifts over time, seasonally and in response to market changes. A model trained on pre-pandemic data will degrade quickly without retraining.
- Real-time data requirements: Static snapshots miss the fast-moving signals that matter most. Effective churn models rely on near-real-time behavioral data, not monthly exports.
- Automation misconceptions: A model that flags risk is not a retention strategy. The prediction is the starting point; the human response is what actually prevents churn.
Types of churn and the concepts behind them
Not all churn looks the same, and the type you’re dealing with shapes which model you build.
Voluntary churn happens when a customer actively decides to leave: they cancel, stop buying, or switch to something else. Involuntary churn happens without intent, typically through failed payments, expired cards, or account suspension. Both require prediction, but the intervention strategies differ completely. A failed payment needs a billing recovery flow; a disengaged subscriber needs a value reminder.
Beyond that split, the business model determines how churn is even measured:
- Subscription-based churn uses non-renewal or cancellation as the event. The window is clear: did they renew or not?
- Transactional churn uses inactivity thresholds. A customer who hasn’t purchased in 120 days might be considered churned, but that threshold is a business decision, not a universal standard.
- Activity-based churn applies to product-led growth models, where inactivity within the product itself signals disengagement before any billing event occurs.
Model types follow from these definitions. Binary classification models answer a yes/no question: will this customer churn within the next 90 days? Survival analysis models answer a different question: when will this customer churn, given their current trajectory? Anomaly detection models watch for sudden behavioral shifts, like a sharp drop in usage or a spike in refund requests, that might signal an emerging churn event before the pattern fully develops.
How churn affects the business beyond the obvious revenue loss
The direct cost of churn is straightforward: lost recurring revenue, plus the acquisition spend required to replace that customer. But the downstream effects are less obvious and often larger. High churn compresses marketing ROI because every campaign that wins a new customer is partially offset by the customers leaving out the back door.
Churn prediction models also serve as a feedback loop for product and service improvement. When a model consistently flags customers who never adopted a specific feature, that’s a product signal, not just a retention signal. It tells you where the onboarding experience breaks down or where the value proposition isn’t landing.
The strategic implications extend further:
- Customer lifetime value: Reducing churn by even a small margin compounds significantly over a multi-year customer relationship.
- Personalized loyalty programs: Risk scores let you tailor offers by urgency and customer value, rather than blasting the same discount to everyone.
- Marketing ROI: Retention-focused spend on genuinely at-risk customers consistently outperforms broad acquisition campaigns on a cost-per-retained-customer basis.
- Long-term growth: A business with a low, stable churn rate grows faster from the same acquisition spend than one constantly refilling a leaky bucket.
You can explore how retention analytics translate into measurable growth across e-commerce contexts for a practical view of these dynamics.
Advanced insights on churn models and interpretability
Ensemble methods, particularly XGBoost and LightGBM, dominate current churn prediction practice because they handle structured tabular data well and outperform simpler models on most real-world datasets. Deep learning approaches, especially LSTM networks, are gaining ground for sequential data like customer interaction histories, where the order of events matters as much as the events themselves.
The harder problem is interpretability. A model that says “this customer will churn” without explaining why gives a retention team almost nothing to work with. Explainable AI tools like SHAP (SHapley Additive exPlanations) help by showing which features drove a specific prediction, letting analysts understand whether the risk comes from billing issues, engagement drops, or something else entirely.
Behavioral signals consistently outperform demographic data as predictors. A customer’s age or location tells you little about whether they’ll cancel next month. What they actually do inside the product, how often they log in, which features they use, and whether their activity is trending up or down, tells you far more. The phrase “logins without outcomes” captures this well: a customer who logs in but never completes a meaningful action is a churn risk even if their session count looks healthy.
Successful retention depends on fast, tailored action triggered immediately after a high-risk flag appears. The model identifies the risk; a human or automated workflow has to respond with the right offer, message, or outreach within the intervention window. Waiting a week after a risk flag appears wastes most of the advantage the prediction created.
Pro Tip: Balance model complexity with interpretability from the start. A slightly less accurate model that your team can explain and act on will outperform a black-box model that no one trusts in practice.
What data do churn prediction models actually need?
Churn models are only as good as the data feeding them. The core requirement is a labeled historical dataset: records of customers who churned and customers who didn’t, with enough behavioral history to identify the signals that differentiated them.
Typical data sources include:
- Product usage logs: Login timestamps, feature interactions, session duration, and activity frequency.
- CRM and support data: Ticket volume, resolution times, sentiment from support interactions, and account health notes.
- Billing and payment records: Subscription tier, payment history, upgrade or downgrade events, and failed transactions.
- Marketing engagement: Email open rates, campaign responses, and promotional redemption history.
- Customer feedback: NPS scores, survey responses, and app store ratings where applicable.
Data quality matters more than data volume. Inconsistent timestamps, missing values in key fields, or poorly defined event labels will degrade model performance faster than a smaller but clean dataset will. For predictive analytics in retail and e-commerce, transactional history combined with engagement data tends to produce the most reliable churn signals.
Industries that rely on churn prediction most heavily
Churn prediction has applications across telecommunications, subscription services, retail, banking, insurance, healthcare, and education. Each industry applies the same core methodology but defines churn and success metrics differently.
Telecom companies were among the earliest adopters, driven by high customer acquisition costs and intense competition. SaaS businesses treat churn prediction as a core operational metric, often building it directly into customer success workflows. Retail and e-commerce brands use it to identify lapsed buyers before they fully disengage, triggering win-back campaigns at the right moment. Banks and insurers apply it to policy renewals and account closures, where a single retained high-value customer can justify the entire cost of the model. For a deeper look at how retention strategies apply across these contexts, the underlying principles transfer well regardless of industry.
How churn prediction models are evaluated and measured
Accuracy alone is a misleading metric for churn models, precisely because of the class imbalance problem. A model that predicts “no churn” for every customer might be 95% accurate in a dataset where only 5% of customers actually churn, yet it’s completely useless.
Better evaluation metrics include:
- Precision and recall: Precision measures how many flagged customers actually churned; recall measures how many actual churners the model caught. The right balance depends on whether false positives (wasted retention spend) or false negatives (missed churners) are more costly.
- AUC-ROC: The area under the receiver operating characteristic curve measures how well the model separates churners from non-churners across all possible thresholds.
- F1 score: The harmonic mean of precision and recall, useful when both matter equally.
- Profit-oriented metrics: Some teams evaluate models directly on the revenue retained per dollar of retention spend, which aligns model performance with actual business outcomes rather than statistical accuracy.
Model performance should be monitored continuously. Concept drift means a model trained six months ago may already be degrading, especially if customer behavior or market conditions have shifted.
Ethical considerations and data privacy in churn prediction
Churn prediction relies on detailed behavioral surveillance of individual customers, which creates real privacy obligations. In the United States, regulations like the California Consumer Privacy Act (CCPA) govern how businesses collect, store, and use customer data. Any churn model built on personal behavioral data needs to comply with applicable data protection laws, including clear disclosure in privacy policies and, where required, consent mechanisms.
Beyond legal compliance, there are fairness concerns. A model trained on biased historical data can produce discriminatory risk scores, systematically flagging certain customer segments for reduced service or fewer retention offers. Teams building churn models should audit their training data for demographic bias and test whether model outputs differ significantly across protected groups.
Transparency with customers is also worth considering. Customers generally don’t know they’ve been scored and that their behavior is being analyzed to predict their departure. While this is legal in most contexts, businesses that use churn scores to offer selective discounts, such as better deals only to customers who threaten to leave, risk eroding trust if the practice becomes visible. The most defensible approach is using churn prediction to improve the experience for everyone at risk, not just to negotiate with the loudest complainers.
How Affinsy helps you act on customer retention signals

Affinsy gives e-commerce and SaaS businesses the customer-level analytics needed to move from raw transaction data to retention action. Through RFM customer segmentation, Affinsy identifies which customers are drifting toward inactivity, which are your highest-value loyalists, and which segments respond to which types of offers. Pair that with market basket analysis to understand what your best customers buy together, and you have a retention strategy grounded in actual behavior rather than guesswork.
Getting started requires no data science team. Upload a CSV of your order history or connect via API, and Affinsy surfaces the patterns your existing data already contains. The permanent free tier covers up to 20K line items with full product access and no credit card required. For larger datasets and API access, Pro starts at $49/month.
Key Takeaways
Churn prediction turns customer behavioral data into risk scores that let businesses intervene before customers leave, with models achieving 70–85% accuracy when properly implemented.
| Point | Details |
|---|---|
| Prediction window matters | Identifying at-risk customers 30–90 days out is when retention efforts prove most effective. |
| Behavioral data beats demographics | Signals like login frequency and feature adoption predict churn far better than age or location. |
| Model accuracy ranges 70–85% | Advanced machine learning models reach this accuracy range when trained on quality historical data. |
| Interpretability drives action | A model that explains why a customer is at risk lets teams respond with the right intervention, not just any intervention. |
| Retention is cheaper than acquisition | Acquiring a new customer costs five to twenty-five times more than keeping an existing one, making churn prediction high-ROI by default. |