
TL;DR:
- Loyalty analysis measures customer commitment by linking behavioral and sentiment data to revenue metrics. It is a continuous process that helps identify genuine loyalty and guides strategic decisions for retention and growth. Regular analysis focusing on active member rates and incremental revenue improves program effectiveness and reduces disengagement.
Loyalty analysis is the systematic measurement and interpretation of customer loyalty by combining revenue metrics with behavioral and sentiment data to guide retention strategy. The term “customer loyalty analysis” is the recognized industry standard for this practice. Business analysts and marketing professionals use it to answer a question that retention rates alone cannot: are customers staying because they genuinely prefer your brand, or simply because switching is inconvenient? Retention is a binary measure, while loyalty is scalable, and that distinction changes every decision you make about program design, rewards, and spend. Tools like Net Promoter Score (NPS), customer lifetime value (CLV), and RFM segmentation are the core instruments of this work.
What is loyalty analysis and why does it matter?
Customer loyalty analysis is defined as the ongoing process of measuring how deeply customers are committed to a brand by linking engagement signals to financial outcomes. The word “ongoing” is doing real work in that definition. Loyalty analysis must be a continuous operational feedback loop linking sentiment and revenue data, not a one-off project. A single quarterly report tells you what happened. A continuous loop tells you what is about to happen.

The importance of loyalty analysis becomes clear when you look at the revenue gap it closes. 70% of B2B brands weaken retention by not connecting loyalty data to actual revenue. That means the majority of organizations are making program decisions based on incomplete signals. Connecting NPS and customer satisfaction scores to CLV and repeat purchase rate is what separates programs that grow revenue from programs that just grow enrollment numbers.
Loyalty analysis also forces a sharper definition of your customer base. A customer who buys twice a year and refers three friends is not the same as a customer who buys twice a year and ignores every communication. Both look identical in a retention report. Loyalty analysis surfaces that difference and tells you where to invest.
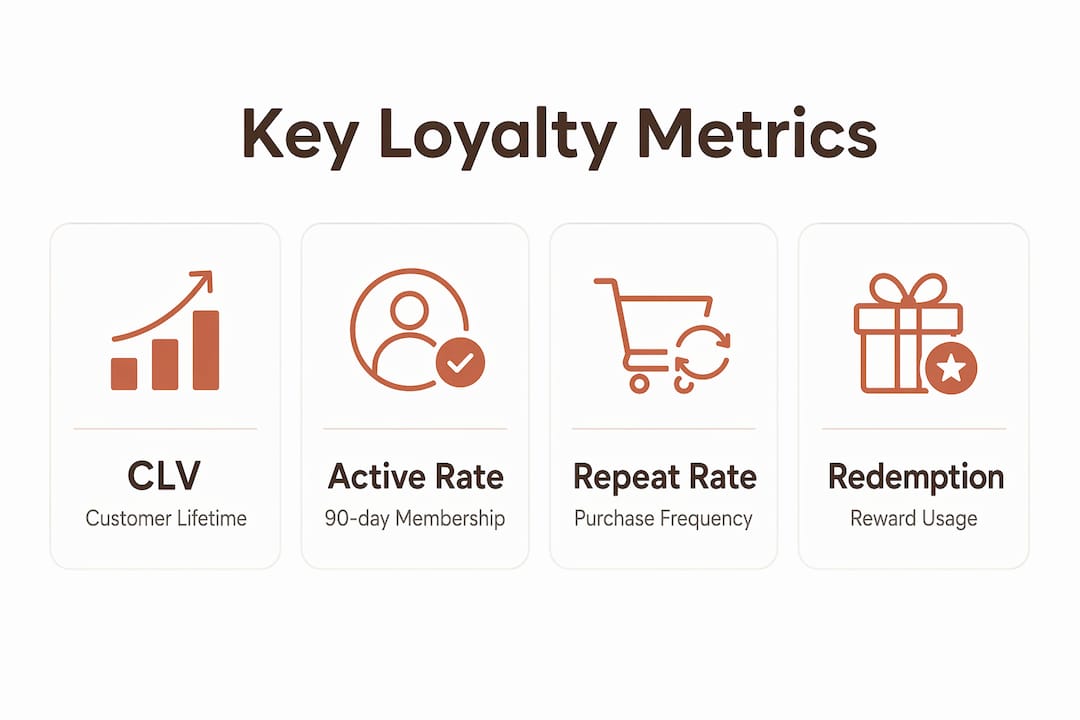
Key loyalty metrics and what they reveal
The core metrics in customer loyalty analysis each answer a different question about program health and customer behavior.
| Metric | Definition | Primary use case |
|---|---|---|
| Customer Lifetime Value (CLV) | Total revenue a customer generates over their relationship with the brand | Prioritize high-value segments for retention spend |
| Repeat Purchase Rate | Percentage of customers who buy more than once in a set period | Measure behavioral loyalty and product stickiness |
| Net Promoter Score (NPS) | Likelihood a customer will recommend the brand on a 0–10 scale | Capture attitudinal loyalty and referral potential |
| Customer Effort Score (CES) | How easy customers find it to interact with the brand | Identify friction points that erode loyalty |
| Active Member Rate | Percentage of program members who engaged or purchased in the last 90 days | Assess true program health, not just enrollment size |
| Redemption Rate | Percentage of earned rewards that members actually use | Measure program relevance and offer appeal |
| Referral Conversion Rate | Percentage of referred prospects who become paying customers | Quantify the revenue value of advocacy |
Active member rate measured over a 90-day window is the most important single indicator of loyalty program health. Total enrollment tells you how many people signed up. Active member rate tells you how many people care.
The primary goal of loyalty analysis is to determine actionable next steps using metrics like redemption rate, repeat purchase rate, and omnichannel cohort CLV. The critical discipline is isolating incremental revenue, meaning revenue that would not have occurred without the loyalty program. Without that isolation, you are measuring correlation, not program impact.
Pro Tip: When reporting CLV to stakeholders, always show member CLV against a matched non-member control group. The delta is your program’s actual contribution to revenue, not the total.
Common pitfalls in loyalty data interpretation
The most damaging mistake in loyalty analysis is treating retention and loyalty as synonyms. Retention measures whether a customer is still active. Loyalty measures how committed they are and how much they spend, refer, and advocate. A brand can have high retention and low loyalty, which typically means customers are locked in by contracts or switching costs, not genuine preference. That distinction matters because the interventions are completely different.
Tracking total program sign-ups without filtering for active participation creates vanity metric risk and hides actual churn. A program with 500,000 enrolled members and a 15% active member rate is not a healthy program. It is a program with 425,000 disengaged customers who inflate your headline numbers.
Other common pitfalls include:
- Ignoring revenue linkage. Sentiment scores like NPS mean little without a corresponding CLV or purchase frequency figure attached to each segment.
- Demographic-only segmentation. Grouping customers by age or location tells you who they are, not how they behave. Behavioral models like RFM reveal purchase recency, frequency, and monetary value, which are far more predictive of churn.
- Fragmented data sources. Loyalty data pulled from a CRM that does not sync with point-of-sale or e-commerce transaction data produces cohorts that do not reflect real behavior.
- One-time analysis. Running loyalty analysis once a year and acting on the findings six months later means you are always responding to the past.
Pro Tip: Focus your reporting on incremental revenue generated by loyalty members, not total sales. Total sales figures include revenue that would have happened regardless of the program.
For a deeper look at the retention side of this equation, the Affinsy guide on retention strategies for online retailers covers the operational side in detail.
Advanced loyalty analysis techniques for deeper insight
Cohort analysis is the most underused technique in loyalty analytics. It groups customers by the period they first purchased or enrolled, then tracks their behavior over time. This reveals whether newer cohorts are more or less loyal than older ones, and whether a program change in march actually improved retention in the following quarter. Ecommerce cohort analysis is the foundation for any honest assessment of program trajectory.
Predictive modeling takes cohort analysis a step further. Relying solely on demographic segmentation is a mistake. Behavioral models like RFM and machine learning based predictive modeling are the current standard for identifying customers likely to churn within a 90-day window. RFM segmentation scores every customer on recency of last purchase, frequency of purchases, and monetary value, then flags which segments need intervention before they go quiet. The Affinsy blog on customer behavior modeling explains how to build these segments from transaction data.
The table below shows how combining data sources produces a more complete picture than any single metric.
| Data source | Signal type | What it adds to loyalty analysis |
|---|---|---|
| POS / transaction history | Behavioral | Purchase frequency, basket size, product affinity |
| CRM / email engagement | Attitudinal | Open rates, survey responses, NPS scores |
| App / web usage logs | Behavioral | Feature adoption, session frequency, last login |
| Support tickets | Sentiment | Friction points, complaint patterns, effort score |
| Referral tracking | Advocacy | Referral conversion rate, word-of-mouth reach |
Integrating transaction data with digital behavioral signals such as support tickets and app usage is what makes cohort and predictive analyses reliable. Without that unified view, your CLV calculations are missing the behavioral context that explains why some customers churn and others do not.
Pro Tip: Monitor the absence of signal as a churn indicator. A customer who stops opening emails, stops logging in, and stops submitting support tickets is often more at risk than one who complains actively. Absence of signal can indicate higher churn risk than a low NPS score.
How to perform loyalty analysis in five steps
Implementing loyalty analysis in a business setting requires a structured approach. The following steps move from data foundation to operational action.
-
Audit your data sources. Map every system that holds customer data: your e-commerce platform (Shopify, WooCommerce, BigCommerce), CRM, email platform, and support tool. Identify gaps where behavioral data is not linked to transaction records. Data quality at this stage determines the accuracy of every analysis that follows.
-
Define KPIs tied to business outcomes. Choose metrics that connect directly to revenue. Active member rate, incremental CLV, repeat purchase rate, and redemption rate are the four metrics that most reliably reflect program health. Avoid metrics that cannot be linked to a financial result.
-
Build segmentation and cohort frameworks. Segment customers using RFM scores rather than demographics alone. Create cohorts by enrollment date, first purchase date, or program tier. These frameworks let you compare behavior across groups and measure the impact of specific program changes over time.
-
Set thresholds for active member rates. Define what “active” means for your business. A 90-day engagement window is the standard benchmark. Any member who has not purchased or engaged within 90 days should be flagged for a re-engagement campaign before they are counted as churned.
-
Translate findings into program actions. Loyalty data interpretation only creates value when it changes something. High redemption rates on a specific reward category signal where to increase offer depth. Low referral conversion rates signal that the referral mechanic needs redesign. Low NPS among high-CLV customers is a retention emergency, not a footnote.
The benefits of loyalty analysis compound when this process runs on a regular cadence, monthly for active member rate and redemption rate, quarterly for cohort CLV and predictive churn scoring. For practical guidance on turning these findings into offers that convert, the Affinsy resource on optimizing retail offers with data is worth bookmarking.
Key Takeaways
Loyalty analysis is only as useful as the revenue linkage behind it. Sentiment scores without financial outcomes are decoration, not strategy.
| Point | Details |
|---|---|
| Loyalty differs from retention | Retention is binary; loyalty is scalable and must be measured behaviorally and attitudinally. |
| Active member rate is the top metric | Track members who engaged within 90 days, not total enrollment, for an honest program health score. |
| Vanity metrics hide churn | Total sign-ups without activity filters inflate program numbers and mask real disengagement. |
| Behavioral segmentation beats demographics | RFM and predictive models identify at-risk customers far earlier than age or location data. |
| Analysis must be continuous | A monthly feedback loop linking sentiment to revenue outperforms any annual loyalty report. |
The metric most analysts overlook
Most loyalty programs I have reviewed suffer from the same blind spot: they measure what customers say and ignore what customers stop doing. An NPS survey response, even a negative one, is a signal of engagement. The customer who goes completely silent is the one about to leave, and most dashboards are not built to catch that.
The second mistake I see constantly is treating loyalty analysis as a reporting function rather than an operational one. Teams run a quarterly analysis, present the findings, and then wait for the next quarter to act on them. By that point, the at-risk cohort has already churned. The organizations that get real value from loyalty data are the ones that set automated triggers: if a high-CLV customer has not purchased in 60 days and has not opened an email in 30 days, a re-engagement sequence fires automatically. That is loyalty analysis working as a system, not a slide deck.
The third thing I would push back on is the obsession with NPS as the primary loyalty metric. NPS is useful for benchmarking and tracking directional sentiment, but it tells you nothing about what a customer actually does. A customer who scores you a 9 but buys from a competitor every other month is not loyal. Pair NPS with repeat purchase rate and CLV before drawing any conclusions about program health.
Loyalty analysis done right is not a measurement exercise. It is a revenue protection system. Build it that way from the start.
— Mateusz
How Affinsy connects loyalty analysis to customer segmentation
Loyalty analysis tells you who your best customers are. The next step is understanding what they buy together and which segments are worth investing in.

Affinsy combines market basket analysis with RFM customer segmentation to turn your transaction history into a clear picture of customer behavior. You can upload order data from Shopify, WooCommerce, Stripe, or any platform that exports a CSV, and Affinsy surfaces the product associations and customer segments that loyalty metrics alone cannot reveal. The free tier covers up to 20,000 line items with no credit card required, so you can validate the approach before committing to a paid plan.
FAQ
What is customer loyalty analysis?
Customer loyalty analysis is the process of measuring how committed customers are to a brand by combining behavioral metrics like repeat purchase rate and CLV with sentiment metrics like NPS. The goal is to connect engagement data to revenue outcomes and guide retention strategy.
How does loyalty analysis differ from retention analysis?
Retention analysis measures whether a customer is still active. Loyalty analysis measures the depth of that relationship, including advocacy, spending patterns, and emotional commitment. A customer can be retained without being loyal.
What metrics matter most in loyalty analysis?
Active member rate over a 90-day window, incremental CLV, repeat purchase rate, and redemption rate are the four metrics most directly tied to program health and revenue impact.
What is RFM segmentation in loyalty analysis?
RFM segmentation scores customers on recency of last purchase, frequency of purchases, and monetary value. It identifies which customers are at risk of churning and which are candidates for upsell or referral programs.
How often should loyalty analysis be performed?
Active member rate and redemption rate should be reviewed monthly. Cohort CLV and predictive churn scoring work best on a quarterly cadence. Treating loyalty analysis as a continuous feedback loop produces better outcomes than annual reporting.
Recommended
- What Is Customer Loyalty? A Guide for Business Professionals - Affinsy Blog | Affinsy
- Unlock customer loyalty with analytics-driven insights - Affinsy Blog | Affinsy
- Top retention strategies for online retailers: boost loyalty - Affinsy Blog | Affinsy
- Understanding Customer Retention: A 2026 Guide for E-Commerce - Affinsy Blog | Affinsy